Too many environmental decisions get made without looking at the full picture. That is what LCA is for.
Whether you want us to run the study for you or need the knowledge to do it yourself, scroll down for an introduction to LCA. If you already know what you need, go straight to how we can help.

What is a LCA?
Every decision leaves a consequence on our environment, often in ways that aren't visible. LCA offers an internationally standardised methodology to evaluate these impacts across the entire lifespan of a product or service through its inputs and outputs. From "cradle to grave," LCA considers all stages: raw material acquisition, manufacturing, transportation, use, and end-of-life treatment (recycling, disposal, etc.).
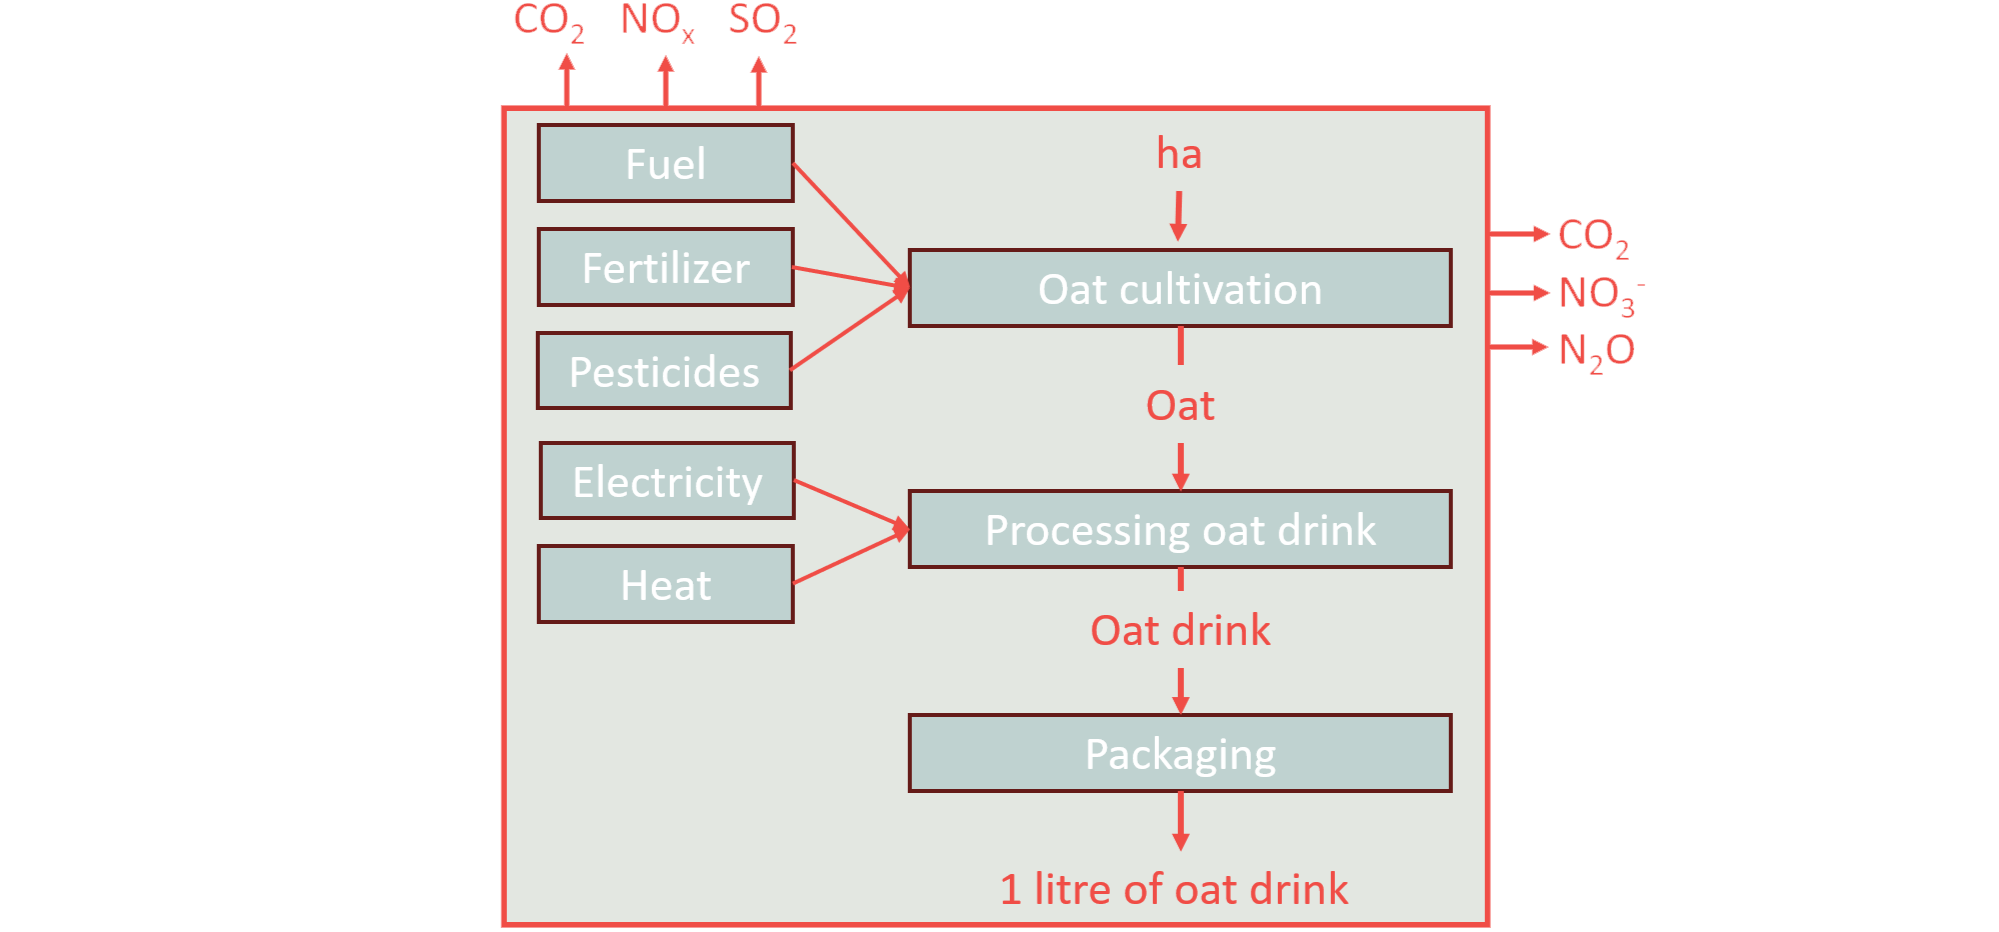
Take 1 litre of oat drink as an example. Producing it involves three main stages: oat cultivation, processing the oat drink, and packaging. Each stage draws on inputs: fuel, fertilizer, and pesticides for the cultivation; electricity and heat for the processing. These inputs all carry their own emissions and resource use. An LCA collects all of them across the entire chain and then translates that long list of raw emissions into impact categories: climate change (CO₂), eutrophication (NO₃⁻), nitrous oxide (N₂O), and so on. What looked like a simple carton of oat drink turns out to touch the whole world.
Most LCA work in practice focuses on biophysical impacts — CO₂ emissions, land use, water consumption, toxicity. That is where most of the available data and regulation sits. But the framework is not limited to that. The same methodology can address social and economic impacts when the data exists and the question calls for it. Weighting, one of the optional steps in phase 3, helps focus the analysis on what matters most for a specific product and context — whether that is climate, biodiversity, or something else entirely.
"LCA can also bring a holistic perspective into decision-making not only focusing on the biophysical environment but also the social and economic environment affected by a decision"
(Peña et al., 2021)
This is not always intuitive. When the EU banned plastic straws, it seemed like an obvious win. But few people investigated what it actually meant to produce metal or cardboard alternatives at scale. A decision that looks good on the surface can have environmental consequences nobody thought to examine. That is exactly the problem LCA is designed to solve.
You may also come across terms like "cradle to gate," "gate to grave," or "gate to gate." These refer to parts of the life cycle, not the full picture. To call something an LCA, it must cover the complete scope from raw material extraction to end-of-life. Anything shorter is an LCA module, which can be useful, but it is not the same thing.
What is the purpose of LCA?
The purpose of an LCA is to give a full, evidence-based picture of the environmental consequences of a product, service, or decision across its entire life cycle. Rather than focusing on a single stage or a single impact (such as carbon emissions), an LCA maps all relevant inputs and outputs from raw material extraction through to end-of-life, so that trade-offs and hotspots become visible.
LCA is a decision-support tool. It does not tell you what to decide, but it gives you the data to choose based on actual environmental consequences, not assumptions.
ISO 14044 identifies the following direct applications of LCA results:
- Development and improvement of products: Identifying where in the life cycle improvements will have the greatest effect, and comparing design alternatives before committing to production.
- Reporting: Providing quantified, evidence-based data for sustainability reports, Environmental Product Declarations (EPDs), corporate disclosures, and regulatory submissions.
- Policy planning: Informing legislation, procurement standards, and sector-specific guidelines with life-cycle-based evidence rather than single-metric proxies.
- Marketing: Substantiating environmental claims about products or services, reducing the risk of greenwashing, and supporting third-party verified communications.
- Other: Including procurement decisions, strategic investment analysis, supply chain optimisation, and any context where understanding full environmental consequences is needed.
The intended application must always be stated in Phase 1 (goal and scope definition), because it determines which methodological choices are appropriate throughout the study.
LCA vs carbon footprint
Most organisations have done a carbon footprint at some point. LCA is not the same thing.
A carbon footprint measures greenhouse gas emissions. That is useful. But it is also narrow. It tells you how much CO₂-equivalent your product or process generates. It does not tell you what else is happening.
LCA covers a much wider set of environmental impacts across the same full life cycle: resource use, water consumption, land use, biodiversity loss, air and water toxicity, and more. This matters because solutions that look good on carbon can perform poorly on other dimensions. A company that switches to a biofuel to cut its carbon footprint may, depending on the feedstock, increase its land-use impact and harm biodiversity in ways the carbon number never shows.
This is what we call carbon tunnel vision. LCA is the way out of it.
So if you already have a carbon footprint, LCA is not a replacement. It shows whether the direction you are heading in is actually the right one.
Why is LCA important?
Most environmental decisions are made with incomplete information. A company reduces packaging and calls it a win. A government bans one material without checking what replaces it. A procurement team picks the cheaper supplier without knowing where the cost saving actually comes from.
LCA closes that gap. It replaces assumption with evidence — across the full life cycle, across all relevant impact categories, and at a level of detail that reveals where the consequences actually sit. The result is that organisations can stop guessing and start acting on what the data shows: which stage drives the most impact, where improvements will matter, and whether the direction they are heading in is actually the right one.
System boundaries: cradle to gate vs cradle to grave
Every LCA has a system boundary that defines what is included. The most common terms:
- Cradle to grave covers the full life cycle: raw material extraction, production, transport, use, and end-of-life. This is what a complete LCA requires.
- Cradle to gate covers raw material extraction through to the factory gate. Use and end-of-life are excluded.
- Gate to grave starts at the factory gate and runs to end-of-life. Production and upstream inputs are excluded.
- Gate to gate covers a single stage of production, such as one process or facility.
Only cradle-to-grave studies are a full LCA. The other scopes are LCA modules. They serve specific purposes but cannot replace the complete picture.
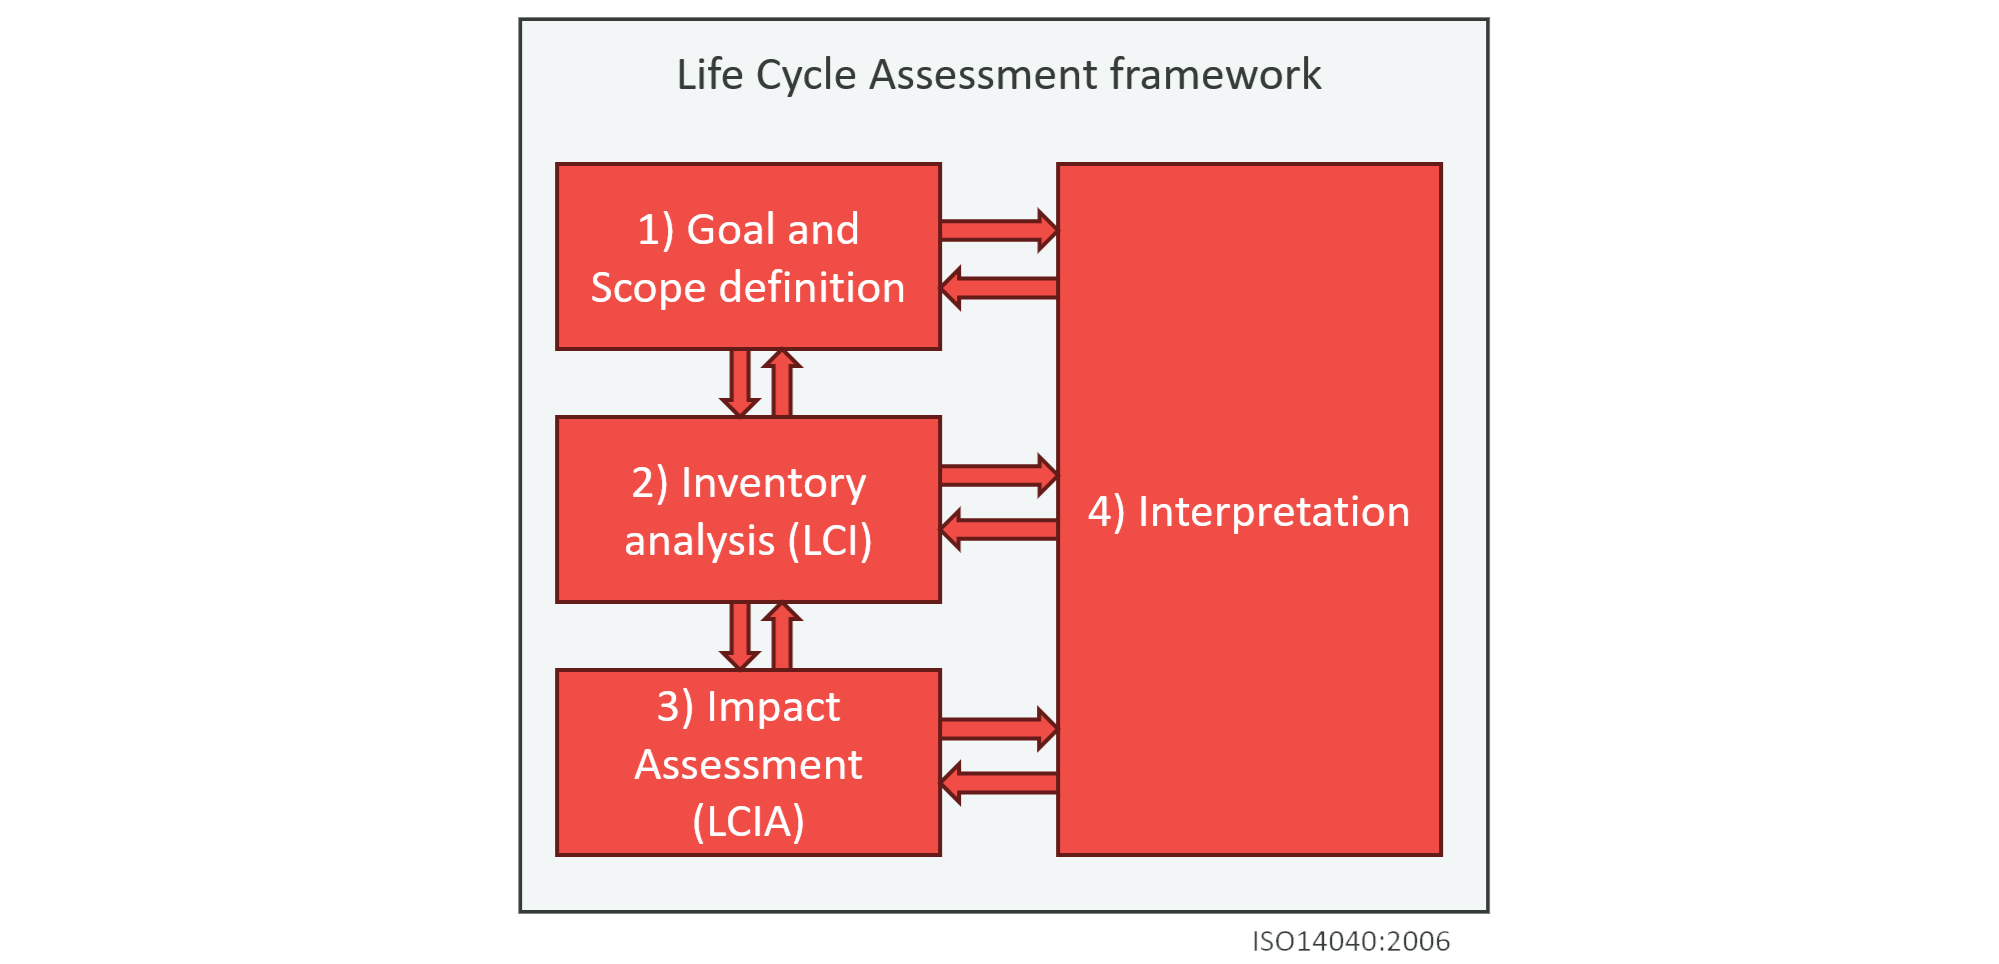
The four phases of an LCA study
Every LCA follows the same four-phase process, regardless of the method or industry. This is defined by the ISO standard. The phases are not a checklist to move through in sequence. In practice, you loop back constantly: data collected in phase 2 often forces you to revise the goal you set in phase 1, and conclusions drawn in phase 4 may require you to revisit your modelling assumptions. That iteration is built into the framework.
Phase 1: Goal and scope definition
This is the phase where most LCA studies go wrong.
A missing or poorly defined goal and scope is one of the most common errors in practice. Without it, you cannot say anything meaningful with your results. The choices you make here determine every methodological choice that follows. If your goal is to compare two products, only one or two frameworks can do that. If you need to report to the PEF standard, that determines your approach. Getting this right at the start saves a lot of rework later.
The goal and scope phase covers five things. First, you define what you are investigating: the product or service, the purpose of the study, and the decisions it should support. Are you doing a hotspot analysis? Comparing two alternatives? Reporting for regulatory compliance?
Second, and most commonly mishandled, is the functional unit. This is the reference to which all inputs and outputs are related: the performance delivered by the product system. It must reflect the function, not just the physical product.
A good example: comparing two office chairs. If you say "one office chair," you ignore lifespan entirely. A chair that lasts three years and one that lasts fifteen are not comparable on that basis. The functional unit should instead be "seating support for a minimum of seven years." Then you calculate how many of each chair you actually need to deliver that function, and the comparison is valid.
Defining the functional unit requires first identifying which market segment your product belongs to: who buys it, what they need it to do, and what they would substitute it with. These are the obligatory product properties. They vary by geography, use case, and customer group, and they must be expressed quantitatively. Often the best source is your client's marketing team: they already know it.
Third, you set the system boundaries: what is included in the study, and what is not. Fourth, you document your assumptions and limitations. Fifth, you state the target audience and the intended application. A reviewer cannot assess whether your methodological choices are appropriate if they do not know what the study is for.
The functional unit and the reference flow are related but not the same. The functional unit describes the function being delivered — for example, 1 kg of plant-based protein for human consumption. The reference flow translates that into a specific product quantity: 2.2 kg of soybeans or 3.7 kg of fava beans, because they have different protein content. The reference flow is what you actually put into the model and compare.
Functional unit explained
The functional unit defines what you are actually comparing. It is not the physical product — it is the performance that product delivers. A complete functional unit answers three questions: what does the product do, how well does it do it, and for how long?
These dimensions are captured through the obligatory product properties: the properties a product must have to be considered a relevant alternative by customers in the relevant market. Obligatory properties typically cover the main functionality, technical quality (stability, durability, ease of maintenance and repair), purchase costs, and costs or services related to use, recycling, or disposal. All of them can be expressed quantitatively — typically as intervals with minimum and/or maximum values.
A product's obligatory properties can vary depending on the customer group, geographical location, and time. This means the relevant market must be described precisely and its boundaries justified and documented. The office chair example illustrates why this matters: "1 office chair" ignores lifespan entirely. "Minimum 7 years of computer workstation seating support" captures the function, quality expectation, and duration — and forces the comparison to account for how many chairs of each type are actually needed.
Beyond the obligatory properties, non-obligatory properties such as colour, fabric, or dimensions are not part of the functional unit, but they can still affect overall impacts and are relevant to acknowledge in the assessment.
Once the functional unit is defined, a reference flow must be set for each product system. The reference flow translates the functional unit into a specific quantity of product: 2.2 kg of soybeans or 3.7 kg of fava beans to deliver 1 kg of plant-based protein, for example, or 10/7 of an office chair with a 10-year lifetime to supply 7 years of seating support. The functional unit is what you are comparing; the reference flow is what you actually put into the model.
Learn more
Phase 2: Life cycle inventory (LCI)
This is where around 95% of the actual work happens. It is the data collection phase, and it is the grunt work.
You collect data on every input and output across the entire life cycle: raw materials, energy, packaging, processing, transport, waste. Not just for your own processes, but for everything upstream too. If you produce oat drink, you include the oats, the pesticides used to grow them, the energy used to produce those pesticides, and so on. You trace back everything that has changed in the world as a consequence of producing that product.
Once collected, the data is linked together into a model. Each process connects to the others, and you can start to quantify total inputs, consumption, and emissions across the full system.
The credibility of your LCA is won or lost here. Data quality determines result quality. Documenting your data sources, the proxies you used, and your modelling choices clearly is not optional: it is what makes results defensible and, where possible, reproducible.
Data comes from two sources. Primary data comes directly from the facility or client: energy use, material inputs, waste volumes. Secondary data comes from background databases, statistics, or published research.
The building block of an LCI is the unit process: any activity that transforms inputs into outputs. Processes in the foreground system are modelled with primary data — typically those the client controls directly. Processes in the background system use data from a database for everything further upstream.
Phase 3: Life cycle impact assessment (LCIA)
The inventory from phase 2 produces a long list of emissions and resource flows. Phase 3 translates that into something meaningful.
Each emission is assigned to one or more impact categories using characterisation factors. Global warming potential, acidification, eutrophication, biodiversity loss, water use, and resource depletion are common examples. The goal is to group and aggregate the raw data so you can see where the real environmental consequences sit, and compare across different types of impact.
Characterisation factors make this possible by converting different emissions into a common unit. For global warming potential, that unit is CO₂-equivalent (CO₂-eq): a way of expressing how much warming a given gas causes relative to CO₂. 1 kg of methane, for example, equals approximately 28 kg CO₂-eq; 1 kg of nitrous oxide equals approximately 273 kg CO₂-eq. This allows all greenhouse gases to be summed into a single number. The same logic applies to other impact categories: ecotoxicity, acidification, and eutrophication all use their own reference substances and conversion factors to make unlike emissions comparable.
Phase 3 also includes optional steps that are, in practice, more necessary than the ISO standard suggests. Normalisation compares your results to a reference value, such as total annual impacts in a region, putting the numbers in context. Weighting assigns relative importance to different impact categories based on priorities or value choices. This is effectively a materiality assessment: given everything this product affects, what matters most? Without this step, you are left with a table of numbers and no clear sense of where to focus.
Phase 4: Interpretation
The final phase brings the results back to the original question: what did I ask, and what does the analysis actually tell me?
This involves checking completeness, running sensitivity analysis, and asking whether the conclusions hold up even if key assumptions were off. A good sensitivity analysis tests whether the result would change if key parameters shifted significantly. If the conclusion remains the same, you can state it with confidence. If it does not, you need to flag that limitation clearly.
Interpretation also produces the recommendations: what should the organisation do, and where will changes have the most impact?
The four phases are never strictly sequential. When data does not fit the model you defined in phase 1, you go back and revise. When interpretation raises a question that requires more data, you return to phase 2. Experienced practitioners expect this iteration and build time for it.
"life cycle assessment (LCA) compilation and evaluation of the inputs, outputs and the potential environmental impacts of a product system throughout its life cycle"
ISO 14040 and ISO 14044 explained
To be called an LCA, a study must follow the ISO 14040 and ISO 14044 standards.
- ISO 14040 defines the principles and framework: what LCA is, what it covers, and the four phases.
- ISO 14044 provides the detailed requirements for each phase, covering data collection, impact assessment, and interpretation.
These are the minimum standards. Other frameworks add rules on top of ISO and remain compliant with it. Knowing which standard applies to your purpose is part of the goal and scope definition.
Because LCA is not an exact science, results depend on data quality, modelling choices, and functional unit definitions. Two independent studies of the same product can reach different conclusions if they use different databases, system boundaries, or characterisation methods. Comparing results between independent studies is generally not valid unless all methodological choices are identical.
Learn more
Other standards and frameworks for LCA
ISO 14040 and 14044 set the baseline. A number of other standards and frameworks build on top of them, adding sector-specific rules, stricter data requirements, or narrower scope to serve particular reporting or regulatory purposes:
- ISO 14067: Quantifying and communicating the carbon footprint of products, based on LCA principles but limited to greenhouse gas emissions.
- EU Product Environmental Footprint (PEF): The EU Commission's methodology for environmental performance of products and organisations. Aligned with ISO, but with prescribed impact categories, characterisation methods, and data quality requirements.
- EU Renewable Energy Directive (RED): Sets sustainability criteria and GHG calculation rules for biofuels and bioliquids using LCA methodology.
- GHG Protocol: The most widely used corporate standard for greenhouse gas accounting. Applies LCA-style system thinking but covers carbon only.
- PAS 2050: A British standard for assessing life cycle GHG emissions of goods and services.
- FAO LEAP Guidelines: Sector-specific guidance from the UN Food and Agriculture Organization for LCA of livestock and feed supply chains.
- Science Based Targets initiative (SBTi): A framework for setting emissions reduction targets aligned with climate science, increasingly relying on LCA data for Scope 3 emissions.
- International Dairy Federation (IDF) Guide for LCA: Sector guidance for dairy products.
- EN 15804: The European standard for Environmental Product Declarations (EPDs) in the construction sector, built on ISO 14044.
All of these sit on top of ISO 14040 and 14044 — they do not replace them. Which framework applies to a given study is determined in Phase 1 (goal and scope definition). If there is no external requirement, ISO alone gives sufficient flexibility. If the study feeds into a regulatory process, a procurement system, or a public claim, the relevant framework will typically specify the methodology in detail.
Reporting and critical review
All LCA work must be compiled into a report following the ISO standard structure. The report makes the work usable: it allows clients, decision-makers, and reviewers to understand what was done and draw conclusions from it.
The ISO standard does not require full reproducibility, but best practice goes further. A good report documents every modelling choice: which background process was selected, what proxy was used when exact data was unavailable, and what was changed and why. The minimum is a clear inventory table showing each input, its data source, and the reasoning behind that choice.
Critical review is required when LCA results appear in comparative assertions made public — for example, a marketing claim that one product is better than another. It involves independent review by a qualified expert or panel. Even when not required, an internal peer review improves quality.
The methodological choices in LCA matter more than most newcomers expect. They determine what question the study can actually answer, and they are where most of the substantive disagreements in LCA practice come from.
Attributional vs consequential LCA
The choice between the two main LCA methods determines what question the study can answer.
Attributional LCA (ALCA) describes the environmental burden associated with a product as it exists today. It uses average data and answers: what share of today's impacts belongs to this product? ALCA is common in annual reporting and benchmarking: Product Environmental Footprints (PEF), the GHG Protocol, and Environmental Product Declarations (EPDs) all use attributional approaches.
Consequential LCA (CLCA) models what happens in the world as a result of a decision. It answers: what are the environmental consequences of choosing this option over that one? CLCA is designed for strategic questions (roadmaps, investment decisions, product comparisons) because it models cause and effect explicitly.
The two approaches require different modelling choices: system boundaries, how co-products are handled (system expansion in CLCA, allocation in ALCA), and which background data to use (marginal vs average suppliers).
Using ALCA results for comparative decisions (choosing which product to buy) is one of the most common misapplications of LCA. ALCA describes today's footprint; it cannot say which choice leads to lower future impact.
It is possible to run both approaches in parallel, making results usable for both reporting and decision-making.
A note on prospective LCA: some studies model how the world will look in the future, for example how the electricity grid will change over 20 years. This is distinct from standard CLCA. A simpler version looks at marginal trends: how the world is most likely to develop in the near term, rather than modelling a full transformation.
Learn more
Hotspot analysis
A hotspot analysis is an LCA that maps where in a product's life cycle the largest environmental impacts occur. Rather than comparing two options, it examines a single product to show which processes, materials, or stages drive the most impact.
The results identify where to focus improvement efforts. If 80% of a product's climate impact comes from one raw material, that is where attention should go first. Without the full life cycle view, these concentrations of impact are often invisible: a company might spend effort reducing packaging while the dominant impact sits in upstream production.
Hotspot analysis is often the entry point into LCA for organisations doing it for the first time. It answers: where do we start?
Going deeper: life cycle concepts and system modelling
The four phases give you the framework. Within that framework, some questions come up again and again that require more careful handling. These are the topics that trip people up most often, and where a methodical approach matters most.
The choice between CLCA and ALCA (covered above) affects every topic in this section: which market data to use, how to handle co-products, and where to draw system boundaries.
Linking unit processes and market mix
How you connect processes in your model depends on which type of LCA you are doing. In CLCA, you model marginal markets: which producer would actually respond to a change in demand? In ALCA, you use average markets: what is the typical mix of production? A related question is whether you are producing or purchasing a given input, as this affects which data applies.
Co-production and waste
When a process produces more than one output, you have to decide how to handle the environmental burden. In ALCA, allocation divides the impacts between outputs based on mass, energy content, or economic value. In CLCA, the standard approach is system expansion: instead of dividing impacts, you expand the system to include what the co-product replaces on the market. If oat processing produces oat pulp that displaces animal feed, the impacts of producing that displaced feed are credited to the system. The ISO standard prefers system expansion where possible, but both methods are in widespread use. Determining which outputs are co-products and which are waste is itself a methodological question, and there are decision frameworks for working through it.
Land use and land-use change (LUC)
Land use is one of the most underestimated impact categories in LCA, particularly for agricultural and bioenergy products. CLCA accounts for indirect land-use change: if demand for a crop increases, what land gets converted elsewhere? ALCA uses historical land-use data, reflecting what was used in the past.
Databases
LCA results depend heavily on background data. The two main types are process-based databases and input-output databases.
- Process-based databases (such as ecoinvent) are built from engineering data and contain detailed unit processes. They have high specificity but may not cover capital goods and services such as machinery, buildings, and infrastructure.
- Input-output databases (such as ExioBase) are built from national economic accounts and cover entire economies; nothing is left out. The trade-off is lower resolution: a single entry might cover an entire industry in a country.
- Hybrid approaches combine both: IO data covers capital goods and services, while process-based data adds detail where it matters most. This is the most common approach in practice.
Within one study, one background database should be the primary source. Mixing databases without checking consistency creates problems that are hard to detect and harder to fix.
A well-structured LCA is only as credible as the data and process behind it. What separates a reliable study from a misleading one comes down to a few recurring issues worth knowing whether you are commissioning, conducting, or reviewing LCA work.
Primary vs secondary data
LCA results are only as good as the data behind them. Understanding the difference helps when assessing the quality of a study, whether your own or someone else's.
Primary data comes directly from the facility or operation being studied: energy meters, purchase records, production reports. It is specific and directly relevant, but collecting it takes time.
Secondary data comes from background databases, published research, or industry statistics. It is less specific but covers the thousands of upstream processes that cannot be measured directly. Databases like ecoinvent aggregate secondary data from research and industry sources.
The best LCA studies use primary data for the processes the client controls directly, and secondary data for everything else. When secondary data is used as a proxy, that choice should be documented and justified.
Uncertainty and sensitivity analysis
LCA results are always estimates. The goal is not precision for its own sake, but getting close enough that the conclusion is reliable.
Sensitivity analysis tests whether the conclusion changes if key assumptions are wrong. If the result holds even when major inputs are varied by a wide margin, confidence in the conclusion goes up. If the conclusion flips with a small change in one assumption, that assumption needs closer attention.
Contribution analysis breaks down where the impacts come from across the life cycle. This shows which processes drive the result, useful for both quality control and explaining findings to clients.
When data is missing, use a proxy. A rough proxy is better than leaving a process out entirely, because omitting something implies it has zero impact, which is almost never true. Document the proxy and state the limitation clearly.
LCA and greenwashing
One of the most common concerns organisations bring to LCA is greenwashing. The worry is understandable: what if the data does not look good? What if the results are used against you?
The answer is simpler than most people expect. Transparency is the protection. As long as you are clear about what you did, what data you used, and where the limitations are, the results cannot be turned against you. What invites criticism is hiding something, not disclosing it.
A well-documented LCA that says "based on the best available data, this is our assessment, and these are the limitations we are working to improve" is defensible. An LCA that presents a polished number with no explanation of the assumptions behind it is not.
This is also why we never produce results without the methodology to back them up.
Contribution analysis and sensitivity analysis, done transparently, also show where to focus data collection efforts to improve quality over time.
Use cases
LCA is a general-purpose tool. The same four-phase framework applies whether the goal is to redesign a product, respond to a regulation, or inform a long-term strategic decision. What follows are three contexts where it tends to have the most direct impact.
LCA for procurement
Procurement is one of the most direct levers an organisation has over its environmental footprint. Most of the impacts from a product or service sit in the supply chain, not in the organisation's own operations.
LCA gives procurement teams data to ask better questions: which supplier has the lower-impact production process? Does the lower-cost option carry a higher environmental cost elsewhere? Which materials drive the most impact in the supply chain?
A full LCA is not needed for every purchasing decision. A well-structured LCA for key product categories identifies the hotspots, and those findings can then inform procurement criteria and supplier conversations.
LCA for product design
Environmental impact is largely locked in at the design stage. Choices made during development (materials, production process, packaging, expected lifetime) determine the majority of a product's life cycle impacts before it reaches a customer.
LCA in the design phase answers: if we change this, what happens? It tests alternative materials, compares production routes, and identifies which design choices lead to the largest reductions. The earlier in the design process LCA is used, the more freedom there is to act on the results.
LCA for strategy
Strategy requires understanding consequences. When a company considers switching to a new raw material, entering a new market, or committing to a net-zero target, the environmental consequences are not always obvious.
Consequential LCA is particularly useful here. It models what actually changes in the world as a result of a decision, not just what the product looks like today, but what happens when you scale it, substitute it, or change how it is produced. This gives a more honest basis for strategic commitments and public claims.
Common mistakes
Some of the most frequent errors in LCA:
- Without a clear functional unit and stated purpose, many modelling choices become arbitrary and results cannot support meaningful conclusions.
- Comparing 1 kg of product A to 1 kg of product B without checking that they deliver the same function produces an invalid comparison.
- Different databases, system boundaries, and characterisation methods make independent studies incomparable, even when studying the same product.
- Process-based LCAs that exclude machinery and infrastructure undercount impacts, which matters when comparing to studies that include them.
- Mixing background databases without checking consistency.
- Not documenting proxy choices, assumptions, or data gaps makes it impossible to review, reproduce, or update the work.
- LCA is always iterative. New data in phase 2 often requires revisiting the goal and scope from phase 1. Treating it as a one-pass process is a mistake.
A good lecture by Jannick Schmidt