

This summer we published our new fully quantitative Life Cycle Sustainability Assessment (LCSA) method and database, all open access. We call it the 2021 Social Footprint method. Social as in welfare economics: ‘An accounting that encompasses the entire societal economy’, not limited to Social as one of the triple bottom lines. And 2021 to signal a significant update from the first 2018 publication.
This month, I presented the method at the 8th International Social Life Cycle Assessment Conference in Aachen, and you can now view the presentation on our YouTube channel. Some important highlights:
4½ years after starting the crowdfunded SDG club we can now present the first complete set of open data for Life Cycle Sustainability Assessment. The results have been made possible by the support from our business partners, including ArcelorMittal, Corbion, Novozymes, and Janus, with funding from the UNEP Life Cycle Initiative SDG project.
The data files include quantitative impact data for 76 impact categories for 163 countries covering more than 99% of global population, GDP and impacts. By applying the ‘capitals’ approach to defining the Areas of Protection, we ensure the 76 impact categories provide an exhaustive coverage of all social, ecosystem and economic impacts. Another unique contribution of our method is the use of sustainable wellbeing (utility, measured in Quality-Adjusted person-Life-Years, QALY) as a comprehensive summary indicator. This allows to quantify relative importance, trade-offs, and synergies across impact categories, and to compare business decisions, performance, and improvement options across industries.
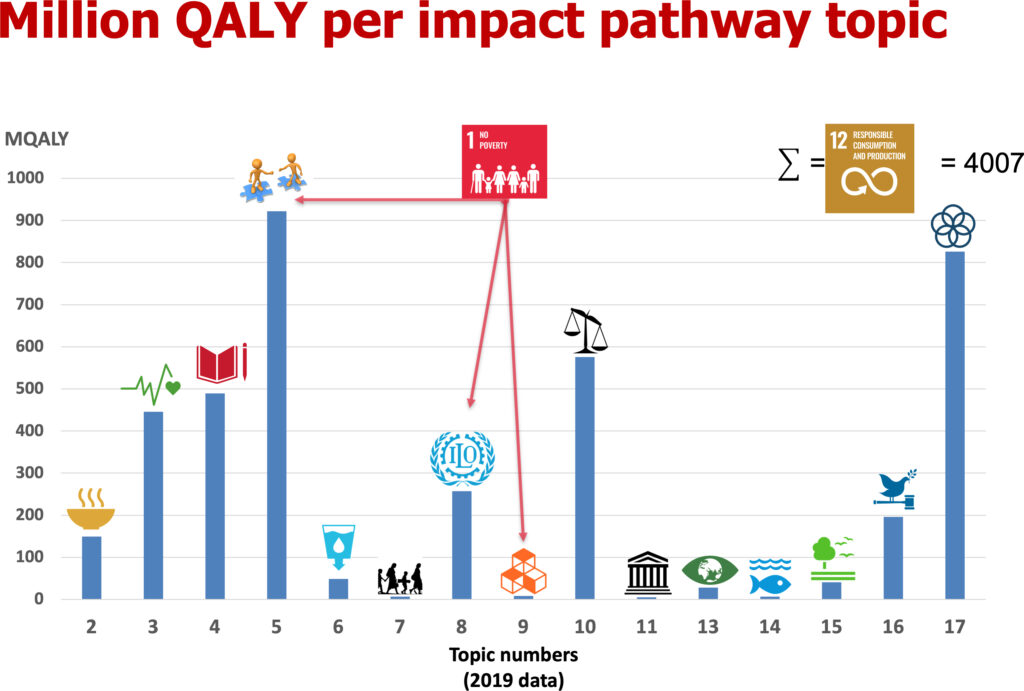
The data files include impact pathways descriptions structured under 17 topics, largely mirroring the 17 UN Sustainable Development Goals (SDGs), however restructuring the indicators so as to avoid overlaps and gaps. The data files include the links between the 17 impact pathway topics and each of the 244 official SDG indicators. Characterisation factors are still under development for each specific impact pathway, linking back to the pressure category indicators, which have been defined to allow for aggregation and disaggregation at any level of geographical, organisational, and product detail.
We find that 31 of the 76 impact categories, representing 78% of all wellbeing impacts, are related to missing governance at the country level, ultimately linked to economic pressure indicators of inequality, notably ‘underpayment of labour and taxes’ and (insufficient) ‘voluntary transfers’. The insight that a large part of the overall impacts (here 78%) come from the same limited set of pressure indicators was used as basis for developing the ‘social footprint’ methodology (Weidema 2018), which has now been updated with these latest method and data improvements. Another 28 impact categories, representing 13% of all wellbeing impacts can be described as having ‘data reasonably available’, including those related to global warming, leaving only 17 impact categories, representing 9% of all wellbeing impacts, with poor availability of pressure category indicators.
The further work on characterisation factors and methodological and data improvements will continue via the crowdfunded Social and Sustainability LCA club where members have early access to updates and support for implementation of the current method in their own case studies.
Just finished the 11th out of the 17 SDG pathways for quantitative SDG impact assessment. They are now ready for inspection in our SDG club and for the business partners of the project ”Linking the UN Sustainable Development Goals to life cycle impact pathway frameworks”. The remaining 6 SDGs will be covered within the next few months. We have focused on describing in detail the business ”pressure” indicators (in LCA speak: Life Cycle Inventory indicators), so that the business partners can start data collection for the foreground processes of their pilot case studies.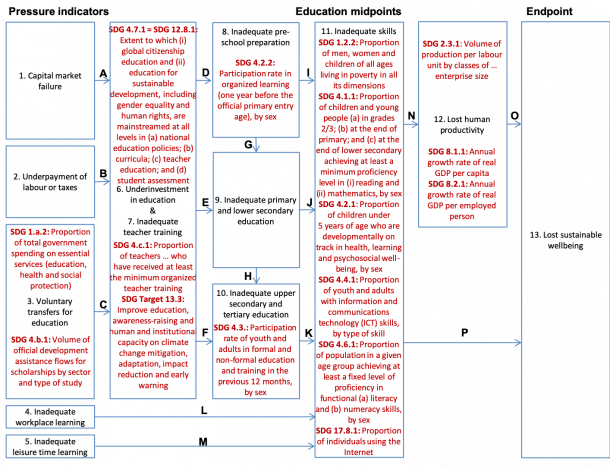
Impact pathways for issues related to “Education” (mainly SDG 4). This is one of the 11 impact pathway diagrams that are now ready. See more examples in the public report.
Even if you are not an SDG club member or business partner for this project, you can have a look at the first results from the project, which have just been made public in the report “LCA-based assessment of the Sustainable Development Goals”. The report describes two different applications: A qualitative life cycle SDG screening building on existing LCA results, and a quantitative life cycle SDG assessment (LCSA) that goes beyond existing LCA indicators, quantifying the impact pathways, and making the contributions to the SDGs comparable by tracing all impacts to a single-score: the ultimate endpoint of sustainable wellbeing. This allows organizations to calculate how much their product contributes to each SDG, target, and indicator, as well as to overall sustainable wellbeing.
For me, the next step will be to finalise a rough quantification of all the 17 impact pathways, so that the data collection and the further detailing can focus on the impact pathways that have the largest importance for overall sustainability.
For the business partners, the next step will be the foreground data collection for their case studies, so that we can start testing the screening and LCSA methods in practice. If your organisation wishes to participate in this first testing round, we still have room for more business partners. Contact me at .
My blog-post last October announced our SDG club – a crowd-funded project to place each of the 169 targets of the 17 UN Sustainable Development Goals (SDGs) into a comprehensive, quantified and operational impact pathway framework, as we know it from Life Cycle Impact Assessment.
Now, with co-financing from the UN Environment Life Cycle Initiative, we have added an elaborate stakeholder consultation to run parallel with the development work, and expanded the project by teaming up with PRé Consultants to cover also the more qualitative approach known from their Roundtable for Product Social Metrics.
To mark the start of this collaboration, we published yesterday a joint, free, 13-page report entitled “Making the SDGs relevant to business”, summarising the existing knowledge on the linking of SDGs to business needs and outlining the role of LCA in meeting the needs and filling the gaps.
We are now looking for businesses that are interested in taking part in the stakeholder consultations and industry case studies. Contact bo.weidema@2-0-lca.com if you want to take part or know more.

Since the UN Sustainable Development Goals (SDG) were published 2 years ago, much has been said on the difficulty in implementing them into business practice. Part of the difficulty comes from the wordings, which often appear better suited for governmental use than specifically for use in a business context. But the main difficulty comes from the sheer number of goals (17) and accompanying targets (169) and indicators (so far 230). While this should provide something for everyone, it also implies an obvious risk of cherry-picking and sub-optimised decision-making. These problems have been pointed out very eloquently by other bloggers, e.g. Nienke Palstra & Ruth Fuller from Bond.
The Business and Sustainable Development Commission have done a great job in pointing out the positive market opportunities that the SDGs open up for first-movers, and the UN Global Compact and the Global Reporting Initiative (GRI) have teamed up in an action platform to provide best practices for corporate reporting on the SDGs, with a first analysis report published last month and a “Practical Guide for Defining Priorities and Reporting” announced for January 2018.
So what can we add from an LCA perspective that has not already been said and is not already being done? Well, what is missing in the approaches mentioned above, and which LCA has always been focused on providing, is an overall framework can avoid shifting of responsibilities and avoid sub-optimised decision-making.
Therefore, we now launch the SDG club, a new crowd-funded project to place each of the indicators for 169 targets of the 17 SDGs into a comprehensive, quantified and operational impact pathway framework, linking forward to sustainable wellbeing (utility) as a comprehensive summary (endpoint) indicator for all social, ecosystem and economic impacts. At the same time, we will link each of the indicators for 169 targets back to company specific activities and product life cycles, using a global multi-regional input-output database with environmental and socio-economic extensions. Due to the use of a single endpoint, this framework will allow to differentiate major from minor impact pathways, to quantify trade-offs and synergies, and to compare business decisions, performance and improvement options, also across industry sectors. With this project, we wish to provide an actionable and rational method for businesses and governments to integrate the SDGs into decision making and monitoring.
This new project builds on and extends the impact assessment method developed by 2.-0 LCA consultants for social footprinting, which has been successfully tested for feasibility in global supply chain contexts. For example, a recent whitepaper from Nestlé appraised our method with these words:
“The great benefit of the Social Footprint method lies in the use of widely available background information from databases to assess social impacts top-down. As opposed to many other approaches, this means that some initial data is available for practically any specific case study, drastically reducing the overall cost”
We invite everyone to join the SDG club and thereby contribute to streamline and coordinate action and increase efficiency in implementing the 2030 Agenda.
See also a previous blogpost on sustainability indicators.
Today, I give a keynote presentation to the “LCA Food 2016” conference in Dublin, on the topic of “Potentials and limitations of LCA for decision support”. The below figure is taken from one of my slides.
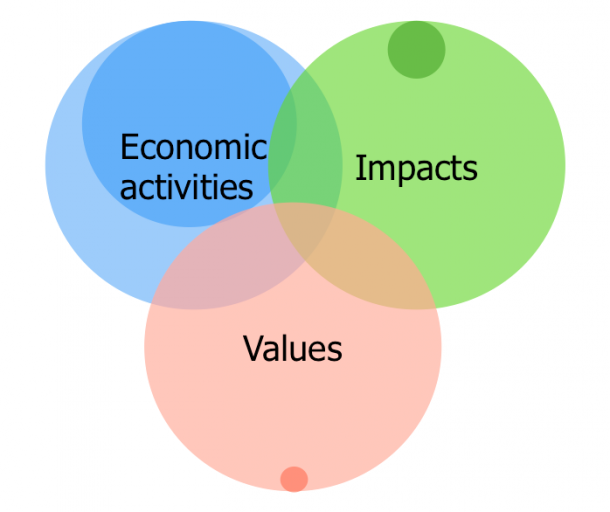
The three circles in the figure show our current knowledge, and the smaller circles within each illustrate how much of this knowledge is typically used by current LCA practice.
A wealth of knowledge is available for and from Life Cycle Assessment (LCA) as it combines three areas of knowledge:
The above considerations can be extended to cover additional aspects of data and model quality, such as the models used for linking data into product systems, the spatial detail of data, the age of the data used, the transparency of the data, the data quality indicators used, and the review procedures applied. For all of these aspects, current LCA practice leaves much to be desired.
The main question for my keynote presentation is therefore: Why is most of current LCA practice so limited?
I have three suggestions for an answer to this question:
My conclusion is that for our knowledge to be used in practice, we need to make these costs matter to LCA practitioners and decision-makers, which means that we need to become involved in the power game around decision-making.
In this power game, we must not only provide knowledge but also empowerment of those stakeholders that have the winning (more environmentally friendly) solutions but currently have too low power to have them implemented. One powerful tool in this game is to call for due diligence by the more powerful players that have the losing (less environmentally friendly) solutions. Because these players are powerful, it may be necessary to find ways to temporarily compensate their losses, to ensure that the best possible compromises can be implemented. To maintain our scientific integrity, we need to lose our political virginity.
Results from lifecycle based environmental assessment are increasingly being expressed through the use of economic terminology. Every second year a new buzzword takes the stage. In this blog-post I try to provide some clarification on two recent buzzwords: E P&L (Environmental Profit & Loss account) and NCA (Natural Capital Accounting).
In 2011, PUMA (the shoe-maker) launched their E P&L, a practice that was followed by several others, including Novo Nordisk and the Danish Fashion Industry. The intention is to complement the company’s normal Profit & Loss account (the financial statement of the income and costs) with an account of the monetarised external benefits and costs related to the life cycle of the product portfolio of the company. Formally, an E P&L should thus be called a ‘Product portfolio E P&L’, which could more lengthily be described as a ‘Product portfolio environmental life cycle assessment with monetary valuation of impacts’. Except for the monetary valuation of the impacts, an E P&L is thus equivalent to what the European Commission calls an Organisation Environmental Footprint (OEF).
In 2013, September 27th, The Guardian had an article stating: “If you are looking for the next big thing in sustainability, you needn't look much further than natural capital accounting”. Last year, in December, the European Commissions Business and Biodiversity Platform published a guide to NCA (Spurgeon 2014), in which E P&L is mentioned as one possible Natural Capital Accounting approach.
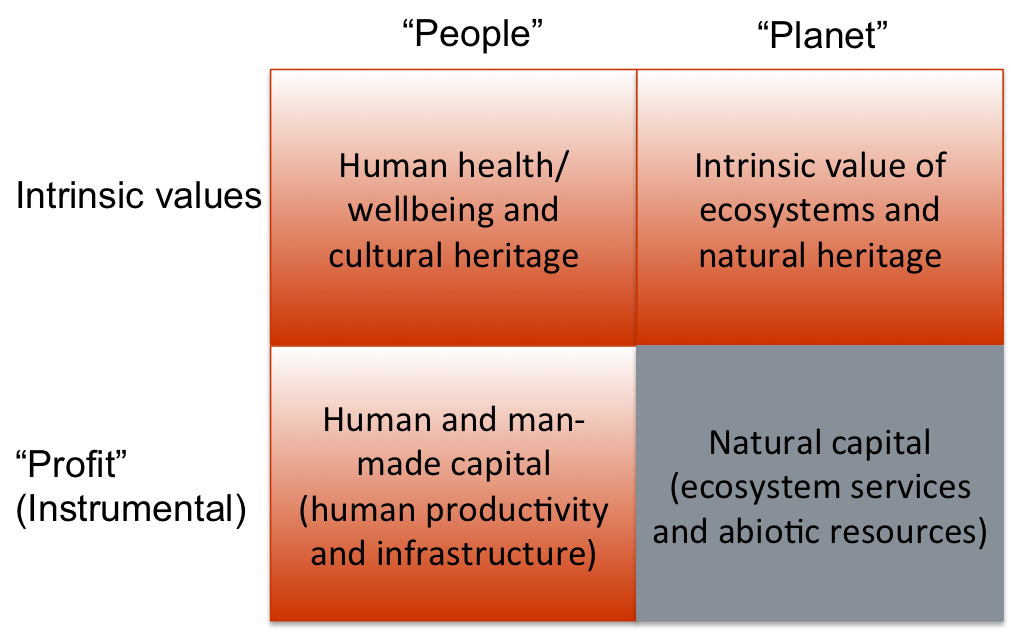
However, capital is essentially a synonym for resources, i.e. those things that enable us to produce goods and services. Natural capital thus covers abiotic natural resources as well as ecosystem resources that provide us with ‘ecosystem services’ – another buzzword that now has been around for 10 years. As such, natural capital only has instrumental value and the term cannot sensibly be used to cover the intrinsic value of nature, i.e. the value that we place on nature in itself and not for what it can produce.
And even more obviously, natural capital cannot sensibly be said to cover the value of the non-natural areas of protection, whether intrinsic (human wellbeing and cultural heritage) or instrumental (man-made and human capital) and thus NCA should never be able to aspire to cover all impacts on these areas of protection.
The below table clearly shows how impacts on natural capital are only a (small) part of the whole picture of environmental impacts. In the table, the different areas of protection are related to the popular “people, planet, profit” concepts.
 The NCA guide (Sturgeon 2014) is actually aware of the terminology problem it creates, since immediately after having presented the definition of NCA as “Identifying, quantifying and/or valuing natural capital impacts, dependencies and assets, as well as other environmental impacts and liabilities, to inform business decision-making and reporting”, the guide goes on to say: “To be more technically correct, the definition for NCA for business should only include impacts and dependencies around ‘natural capital’ and not ‘other environmental impacts’.”
Now we can only hope that the readers come as far as this caveat and do not take the definition out of its context. For my part, I will continue to say that we do ‘Product portfolio E P&L’s and that NCA in its more narrow definition is a part of this.
Reference
Spurgeon J P G. (2014). Natural Capital Accounting for Business: Guide to selecting an approach. Brussels: EU Business and Biodiversity Platform.
The stakeholder approach to sustainability indicator development has led to a plethora of different indicator sets. This makes cross-comparisons difficult and is inefficient in terms of resources that need to be spent on measurement and reporting. Furthermore, important aspects of sustainability may be omitted, either because there is no particular stakeholder interest that defends a specific aspect, or due to concerns for data availability.
An alternative to the stakeholder approach is a more conceptual approach (these approaches are of course not necessarily mutually exclusive) starting from the definition of sustainable development and which in its outset seek complete coverage of what the UNEP/SETAC Working Group on Impact Assessment (Jolliet et al. 2003) called “areas of protection”.
A conceptually complete organisation of “areas of protection” can be seen in Table 1. What I mean by conceptually complete is that any item must be either human or non-human; any non-human item must be either biotic or non-biotic; any value must be either intrinsic or instrumental.
Table 1. Areas of protection in the SETAC/UNEP LCIA framework from Jolliet et al. (2003) slightly modified by Weidema (2006). 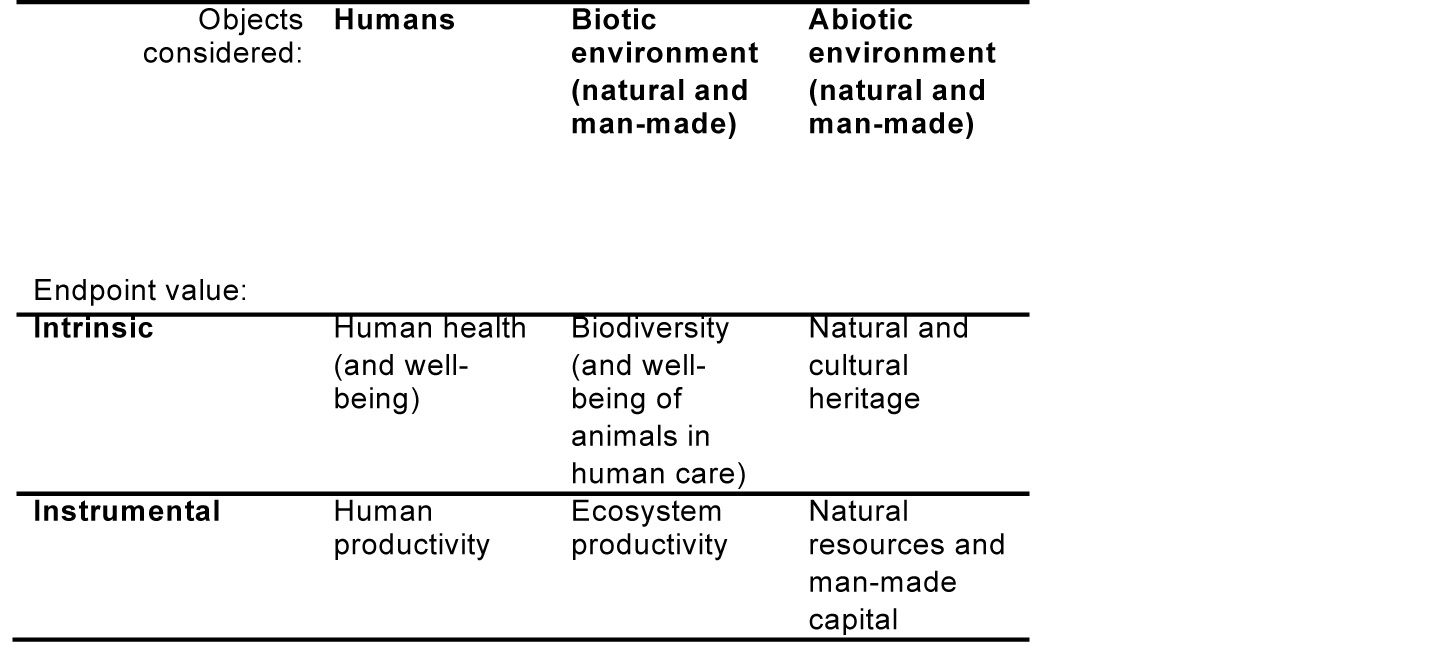 You may note that what is here called “Instrumental values”, may also be called “Resources” or “Capital”, and that both human and man-made ecosystems/resources are covered, without necessarily making an explicit distinction (which of course could be done at a next level).
While such a framework provides completeness, it is of course only the first step towards a complete set of indicators. Another recent important contribution in this field, which also has a conceptual starting point, is the Conference of European Statisticians Recommendations on Measuring Sustainable Development (UNECE 2014). In this report, you can find not only a very comprehensive set of sustainability indicators but also a very clear description of the relationship between these indicators and the national accounting framework. The report particularly points out that for each aspect to be measured, both a geographical (imports/exports) and a temporal (capital transfer to future generations) perspective need to be covered. I reproduce below the graph that illustrate the geographical perspective.
Figure on Sustainable development: “here” versus “elsewhere”. From UNECE (2014).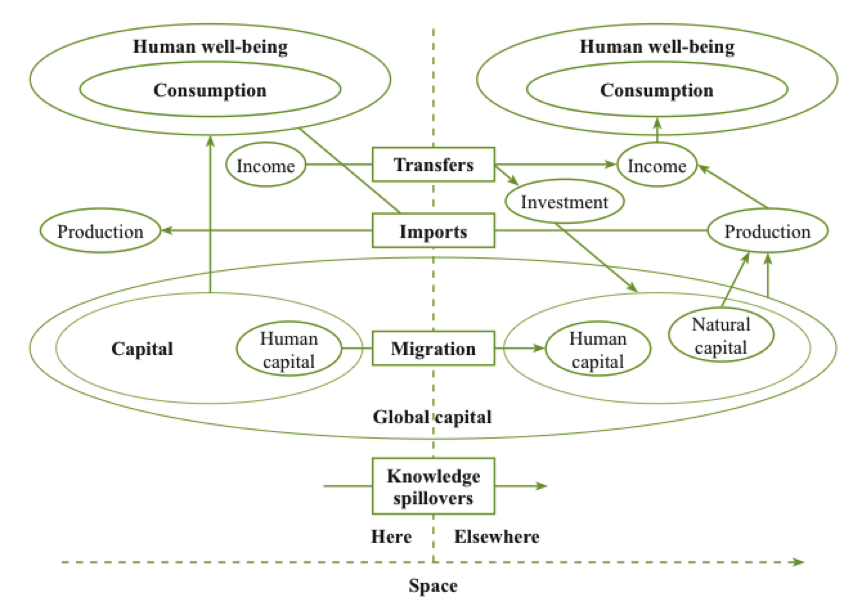 The recommendations have been endorsed by statisticians from more than 50 countries and are expected to contribute to the ongoing United Nations processes for setting up Sustainable Development Goals and the related targets and indicators, and defining a post-2015 development agenda.
The conceptual foundation and the potential indicators suggested in the UNECE publication may serve as a good starting point for further harmonization of the measurement systems and development of a set of indicators that could be used for comparison across countries, and probably with some adaptation also across individual enterprises and products.
References
Jolliet O, Brent A, Goedkoop M, Itsubo N, Mueller-Wenk R, Peña C, Schenk R, Stewart M, Weidema B P. (2003). Final report of the LCIA Definition study. Life Cycle Impact Assessment Programme of The UNEP/SETAC Life Cycle Initiative. Paris: United Nations Environmental Programme. https://lca-net.com/p/1100
UNECE (2014). Conference of European Statisticians recommendations on measuring sustainable development. New York and Geneva: United Nations. www.unece.org/publications/ces_sust_development.html
Weidema B P. (2006). The integration of economic and social aspects in life cycle impact assessment. International Journal of Life Cycle Assessment 11(1):89-96. https://lca-net.com/p/1024


