

By Jesper Dalgaard Pøhler, Client & Relations Manager at 2-0 LCA
At 2-0 LCA we focus on data all the time. Are they solid? Which conclusions can be drawn from the data – and which cannot? And most important: How could they make the world more sustainable? This month, we celebrate the pleasure of having worked together with Stefano Merciai for 15 years. Therefore, we asked him how the sustainability agenda has changed during the time, and what he expects of the future, which seems dark for the time being. Luckily, he is optimistic yet concerned:
“In its essence, sustainability is a way to live in harmony with all the things around us. But we cannot afford wasting valuable materials at the pace we do it now”, Stefano explains as he stresses the importance of improving sustainability data and databases.
Stefano has a background in statistics. Many of his fellow students went to the insurance or bank sector, but he wanted to do something that had a social impact and saw that the area of sustainability needed some attention.
“I have always wanted to work with something that has a social impact and is not destroying our planet, and when I fully realised the interconnection between environment and the social sphere, I moved to sustainability. Sustainability is so important to our daily lives, and I saw an opportunity to apply statistics to that field”, says Stefano.
“What if we scale up this concept to the majority of the population ... can we produce all these environmental-friendly materials in a sustainable way?”
- Stefano Mercai
One good example of the importance of statistics is houses. We all need them, and we all use them. We all want to live in a big independent house with a garden, perhaps paved so it is easier to deal with.
“And then you might think that we just need to use more environmental-friendly materials, make thicker walls and windows, and our dreams are possible. But what if we scale up this concept to the majority of the population? What is the impact on the land use, on the food production, on biodiversity? Further, can we produce all these environmental-friendly materials in a sustainable way? To answer these questions, we need a good quantitative analysis”, Stefano explains.
Therefore, the actually sustainable solution might sometimes seem counter-intuitive to the obvious one. In the case of houses, it could be that a concrete building is more sustainable than a series of independent houses.
“A quantitative approach helps choosing the more sustainable solutions. Without a good quantitative analysis, we might just speculate on unknown foundations. And of course, a quantitative analysis should be done together with social and economic analyses before choosing the desired solution”, Stefano elaborates.
At 2-0 LCA, Stefano Merciai has played a key role in developing the EXIOBASE database, and recently the BONSAI database.
“In the beginning, we started experimenting with building a database to solve a specific problem: We needed waste accounts. The database quickly proved itself very useful, though, and so began the work on EXIOBASE hybrid. Today, we possess substantial knowledge of how to utilise these tools for several sustainability analyses”, says Stefano.
EXIOBASE hybrid is a database showing emissions for products and services from all over the world, and it is now used by multiple companies and organisations especially in Europe. It is a so-called ‘whole-system’ database, meaning that the whole global system is taken into account, whenever users ask for the emission account of a specific product.
“In that way, you ensure that nothing is counted twice and that you can actually compare emissions of different products, whether it is in kilos, Euros, or items or whatever”, Stefano explains.
He has experienced one too many times wasting time on collecting data that other people had already collected or seeing companies making decisions based on poor data. Therefore, he is proud of taking part in the development of the new BONSAI database, which is completely open-source, free to use, and based on the same principles as EXIOBASE, but with a much more flexible setup.
“Today, information is gold. Therefore, data are often hidden to the public.”
- Stefano Mercai
“The goal of BONSAI is to make a reliable database where people can provide and retrieve data. With a solid database as a starting point, we can spend more time on the analytic part, developing effective solutions for the companies that need to take the tough decisions about how to improve their work on sustainability in a way that makes economic sense too”, says Stefano and closes:
“Today, information is gold. Therefore, data are often hidden to the public. But with BONSAI we make good data available to more people and companies to pave the way for finding global solutions on the many challenges from the sustainability agenda. That is one of those things that keep me engaged at work”.
We salute Stefano and are happy that he will stay for another 15 years … hopefully.
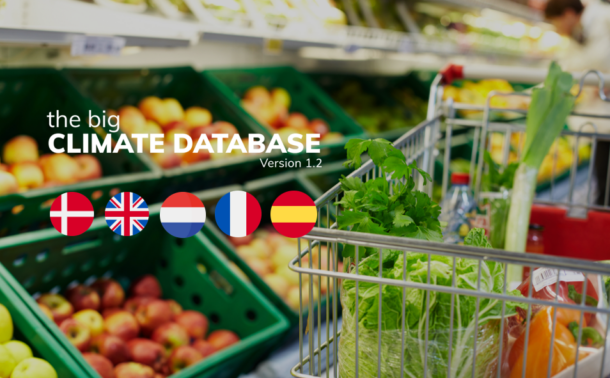
Today we're launching a new an improved version 1.2 of The Big Climate Database.
In 2021 2.-0 LCA consultants and the Danish green thinktank CONCITO launched The Big Climate Database. It provided food industry professionals and consumers with freely accessible and transparent information about the climate impact of 500 common foods on the Danish market.
In January 2024 it was updated and expanded to 503 foods and launched in a version for the UK market.
Now, we’re adding results for the Netherlands, France, and Spain and expanding the database with 37 new food items.
Version 1.2 of The Big Climate Database includes regionalized data at the retail level for the Danish, British, Dutch, French, and Spanish markets and now contains the average climate impact of a total of 540 foods.
Regionalized means, that the climate impact of a French baguette or a Spanish Iberico ham will have the specific climate impact of the food purchased in a French or Spanish supermarket, including all emissions up to the point of purchase. This gives the data unique accuracy and flexibility.
Data for all included countries, the technical details behind the database, and the more than 17,000 underlying datasets are freely available at the new website:
www.thebigclimatedatabase.com.
The most significant changes compared to version 1.1 for the Danish and British markets are due to an updated and detailed model of fertilizer production and for calculating greenhouse gases from indirect changes in land use.
These changes (among many others), mean that the climate impact for all products has increased by an average of about 9%. For 33 foods, the climate impact has increased by more than 20%, while for 176, it has decreased from version 1.1 to 1.2.
This update of The Big Climate Database was carried out and financed by us at 2.-0 LCA consultants, and we’ll continue to improve the datasets behind it and will add more countries and products in the coming years.
Version 1.2 for the Danish market is available as a downloadable version at denstoreklimadatabase.dk, which is managed by CONCITO with targeted information for Danish users of the climate database. The web table will be updated shortly.
The Big Climate Database was launched in 2021 by CONCITO in collaboration with 2.-0 LCA consultants and with support from the Salling Foundations.
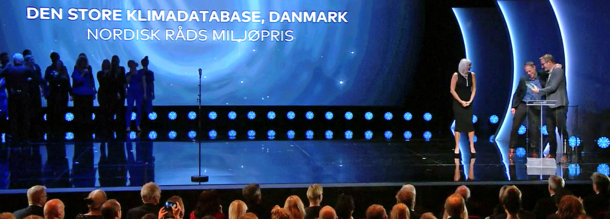
The Big Climate Database was awarded the Nordic Council's Environmental Prize in 2021 for the project's significant changemaking potential.
Version 1.1 was launched in January 2024 with updates and corrections, including the addition of average climate footprints for beef, pork, and chicken, as well as a version for the UK market. The update was released by CONCITO in collaboration with 2.-0 LCA consultants and funded by the prize money from the Nordic Council's Environmental Prize. The UK market version was financed by Zedible.
Version 1.2, with results for Denmark, England, the Netherlands, France, and Spain, and 540 food products, was carried out and funded by 2.-0 LCA consultants. The results, the underlying datasets, and the methodology report are available at thebigclimatedatabase.com.
Our CEO, Jannick Schmidt, was invited on stage together with programme manager Michael Minter at yesterday’s prize show in Copenhagen’s Skuespilhuset to accept the Nordic Council Environment Prize 2021 for the "The Big Climate Database"! It is not often that great data attracts such limelight – but that happened last night.
The Big Climate Database was developed by us for the Danish Think Tank CONCITO with funding from the Salling foundations and has catalogued 500 of the most common foods in Denmark and calculated their CO2 footprint. We are so pleased that the Danish Think Tank CONCITO was honoured for their forward-thinking project.
In 2019 the award was won by Greta Thunberg for calling us to action.
Now it is time to get the right data out to people to substantiate their actions.
You can read the jury's motivation in English here:
https://www.norden.org/en/news/concito-denmarks-green-think-tank-wins-2021-nordic-council-environment-prize
In May this year we proudly presented the third version of our wastewater inventory model, WW LCI, at SETAC Europe’s 29th Annual Meeting in Helsinki, Finland (see the presentation). This constitutes the 5th consecutive platform presentation about WW LCI in a SETAC conference, which is a good sign of the scientific interest that our model has received so far from the LCA community. We take this milestone as an opportunity to look back at the story behind our model.
The developme nt of WW LCI started in 2015 as one of our crowdfunded projects, together with the three companies Henkel, Procter & Gamble and Unilever. Our goal was to develop a model and Excel tool to calculate life cycle inventories (LCIs) of chemicals discharged in wastewater. The choice of partners for this project (consumer goods companies) was not a coincidence. Indeed, after use, many of their products, such as shampoos, washing detergents, etc., end up discharged in wastewater around the globe, which makes wastewater LCI modelling a necessity for these companies when carrying out cradle-to-grave LCA studies. Yet, the only commonly available LCI model covering this aspect to date was the one by my good friend Gabor Doka, developed for version 2 of the ecoinvent database. With our project, we aimed at overcoming several limitations of this model. First, we wanted our tool to describe wastewater as a mixture of individual chemical substances rather than a set of generic descriptors such as chemical oxygen demand (COD). Second, we wanted to cover several sludge disposal routes, namely landfarming, landfilling and incineration. Last but not least, we aimed to include the environmental burdens of untreated discharges, which are unfortunately still very common in developing countries. Before the end of 2015, the first version of WW LCI was ready, as well as an article that would ultimately be published the next year in the International Journal of LCA.
Shortly after the development of our model, we got in touch with Prof. Morten Birkved, from the Technical University of Denmark (currently at the University of Southern Denmark), who was involved in the development of SewageLCI, an inventory model to calculate emissions of chemicals through WWTPs. We decided to join forces and integrate the two models, eventually giving rise to the second version of WW LCI, thanks to the hard work of Pradip Kalbar, current Assistant Professor at the Centre for Urban Science & Engineering (CUSE) at IIT Bombay. Pradip’s work led to key improvements in WW LCI, such as the inclusion of wastewater treatment by means of septic tanks, tertiary treatment of wastewater with sand filtration, treatment of wastewater in WWTPs with primary treatment only, treatment of sludge by composting, as well as the integration in the tool of a database containing wastewater and sludge statistics for 56 countries. Also, Pradip was responsible for our second peer-reviewed publication, this time in the journal Science of the Total Environment.
After some quiet time, in 2018 I decided to get to grips with several limitations of the model, such as the fact that it did not support discharges of metals in wastewater, but more importantly, I realized that by describing wastewater as a mixture of individual chemicals, as in e.g. a list of ingredients in a shampoo formulation, I was closing the door to many LCA practitioners who typically can only describe the pollution content in wastewater with the very generic descriptors I had rejected in the first place, namely COD, among others. Thus, I adapted the model to support metals as well as the characterization of wastewater based on the four parameters COD, N-total, P-total and suspended solids. On top of this, many additional features were implemented, mainly aimed at an improved regionalization, that is, to try and make LCIs more country-specific. Some of the improvements made included: emissions of methane from open-stagnant sewers, climate-dependent calculation of heat balance in the WWTPs, capacity-dependent calculation of electricity consumption in the WWTPs, the inclusion of uncontrolled landfilling of sludge, the specification of effluent discharges to sea water or inland water, and last but not least, expanding the geographical coverage of the statistics database from 56 to (currently) 86 countries, representing 90% of the world’s population (figure 1). The result of this effort, in short, is our third and latest version of WW LCI, presented in May at the SETAC conference.
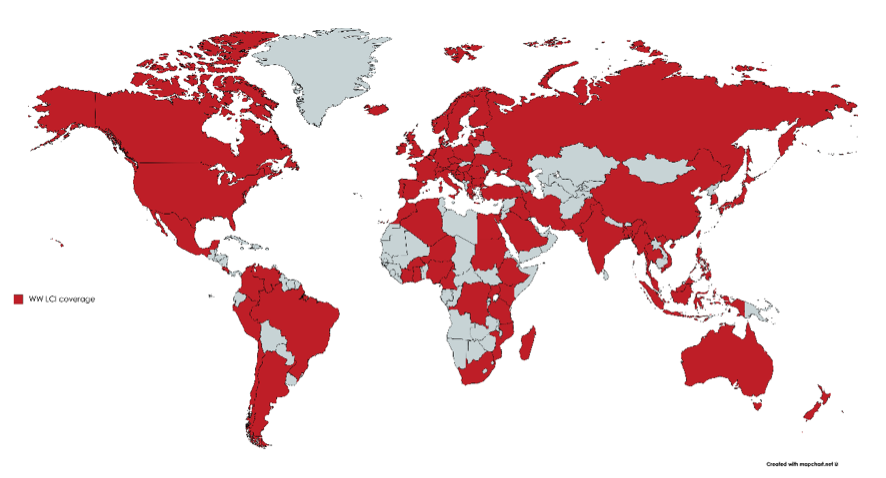
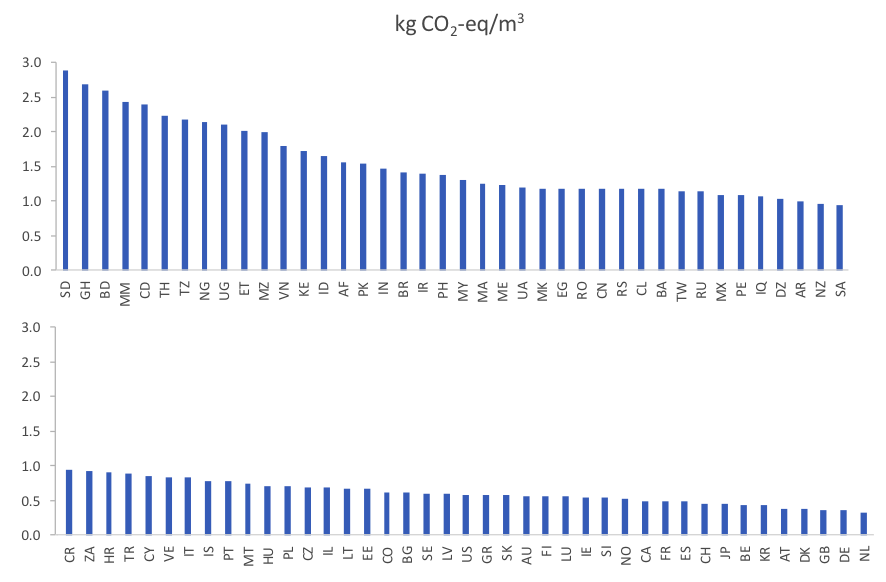
As an example of the current tool capabilities, the figure below (taken from the SETAC presentation) shows the carbon footprint of discharging 1 m3 of a typical urban wastewater in 81 countries. As it can be seen, there is wide variability between countries (up to a factor 6), with highest emissions in those countries where methane from open and stagnant sewers is expected to occur. On the other hand, emissions are substantially lower in countries where wastewater is properly collected and treated in centralized WWTPs. Obviously, the carbon footprint is not the only relevant metric, and WW LCI can support others just as well, including eco-toxicity.
Needless to say, WW LCI is not perfect. We can mention as main model limitations the fact that it does not address uncertainty, its data-demanding nature when used to model specific chemicals, the not-so-easy operation of the excel tool and the export of LCIs being currently limited to the software SimaPro. In spite of this, to our knowledge this is the most complete, flexible and regionalized inventory tool to model urban wastewater discharges in LCA studies and we expect it will eventually become the preferred approach for professional LCA practitioners. We are just a few SETAC presentations away from it.
In a previous blog-post, I used this picture to illustrate the gap between the available information (the large circles) and how much of this information is typically used by current LCA practice (the smaller circles within each large one):
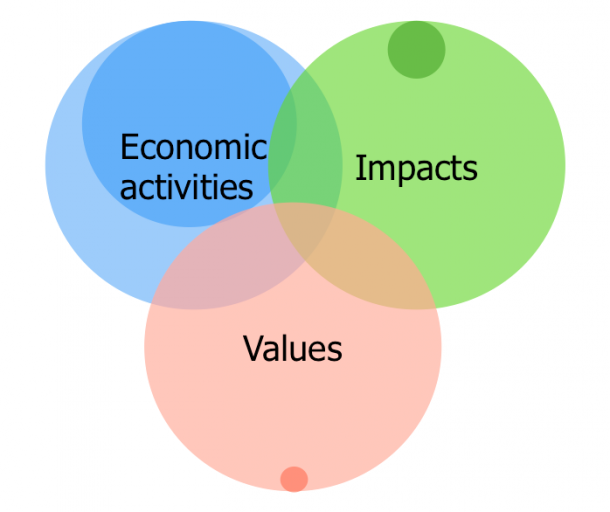
At 2.-0 LCA consultants we have been working hard to ensure that we use the most recent, transparent, reviewed, and spatially detailed data, modelling economic activities with data from globally complete and physically balanced IO-databases, including rebound effects based on marginal consumer behaviour, modelling impacts with a social footprinting method that covers the total global annual loss of natural habitats, human health, and social wellbeing, and by modelling values with data from welfare economics on market prices and representative population surveys, including equity-weighting and science-based discounting.
But staying on top of the current exponential growth of data requires the use of new social and digital technologies: To make efficient use of the options offered by what Klaus Schwab has called the fourth industrial revolution we need to cooperate as a community and use the automated tools of artificial intelligence to create and use linked open data. This is the reason that 2.-0 LCA consultants have decided to sponsor the work of BONSAI – The Big Open Network of Sustainability Assessment Information.
We see how other scientific communities, from astronomy to deep earth seismology, struggle with the same problems of managing the unprecedented amount of data needed to provide increasingly precise understanding and predictions within their fields. We see how these scientific communities have embraced open data as fundamental for the advancement of their research, and have started to cooperate across scientific disciplines.
Last month, I attended – together with BONSAI executive Michele De Rosa - the 9th plenary meeting of the Research Data Alliance (RDA). RDA is a community-driven organization with more than 5000 members from 123 countries, building the social and technical infrastructure to enable open sharing of big data. It was a vibrant, overwhelming experience that confirmed to us that the time for open science is now mature. With an interdisciplinary perspective, the many Interest Groups (IG) and Working Groups (WG) in RDA address common problems such as how to harmonize metadata structure, how to address data classification issues, how to credit scientists for sharing data, how to address the legal issues concerning the sharing and harvesting of data. If you are curious to know more, a full report from our activities at the RDA plenary is now available.
The scientific domains of LCA, industrial ecology and IO-economics, were, to our knowledge, represented at RDA for the first time by us, which made us feel more like representatives of a laggard community than pioneers.
We believe that the LCA community needs to come up to speed and engage more intimately with the data science community, and we therefore intend to maintain a constant presence in RDA. Plenaries are held twice a year and the next plenary will be in September in Montreal. We are working on a session proposal to create an Interest Group within RDA to target the needs of our scientific domain and invite the LCA community to join us with contributions and suggestions.


