On February 1th, our client CONCITO – Denmark’s Green Think Tank published the results of the project ‘LCA of 500 food items’ and created quite a wake in the press and on social media.
The database, which was published under the somewhat pretentious name “The Big Climate Database”, presents climate footprints of 500 selected foodstuffs in an accessible and transparent tool intended as a basis for climate footprint calculation of meals and purchases, as well as for information and teaching.
The database was received with excitement by the Danish public. The day after the publication, the Danish Television published a quiz where consumers could test their knowledge and showed how to prepare mussels, one of the products with lowest climate footprint in the database.
However, several producers’ associations were critical and even allegations of ‘deception’ were put forward. Much to our satisfaction, Michael Minter from CONCITO calmly replied to these criticisms in a blog post and in such an eloquent way that I want to share some of his replies (in my own translation):
Scientists from two Danish universities that have been advising the Danish authorities based on the normative (attributional) LCA approach lament that it is not possible to compare their data with those of the new consequential climate database and fear that consumers and politicians might be confused.
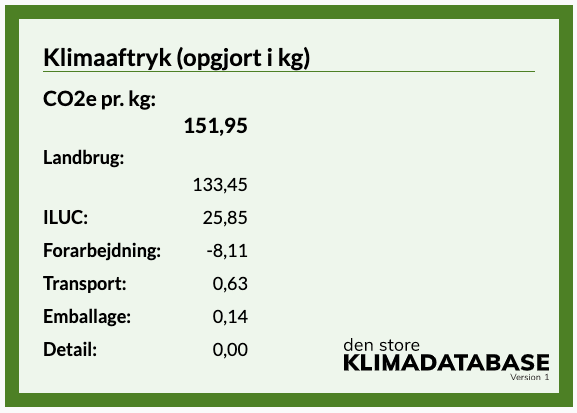
Figure 1 - CO2 equivalent of tenderloin
Especially the high climate footprint of tenderloin (compared to other meat cuts) in the database has been the subject of much debate, since previous reports have only shown the climate footprint for average beef – and this is the highest number the Danish public has yet seen on a beef product.
CONCITO points out that the purpose of the climate database is to compare different food choices, potentially leading to changes in the consumption towards products with a lower climate impact. Therefore, far from being a mistake, the consequential approach is a deliberate choice of method.
In the blog post, CONCITO explains how it is possible with a difference between what consumers influence by changing the demand for a product, and the emissions from the products that you physically use – something can indeed be hard to comprehend. In my translation below:
‘The consequential approach takes into account that a change in demand for a product is not necessarily met by just any manufacturer on the market. For example, the dairy system is very inelastic when it comes to responding to changes in demand for beef. In other words, you do not increase milk production, and the subsequent output of cows and calves for slaughter, when the consumption of beef increases.
The normative approach used by Aarhus University includes all animals that are on the Danish market for beef, and here dairy cows and their offspring are included as a normative fixed percentage of the milk system.
With the consequential approach in the climate database, the climate footprint from beef will be significantly higher than in the normative LCA. This is partly due to the fact that pure beef cattle herds have a major climate impact. Another significant factor is that the consequential approach also includes the climate impact from indirect land use and deforestation to either grazing or fodder production, which is often omitted in the normative approach’.
The use of the price of the different meat cuts to calculate their relative climate footprints has been another point of critique from meat producers and some consumers. But here is the clue:
‘how much a slaughterhouse increases production when the demand for a given cut changes, can be identified by using the price of the product being sold. The slaughterhouses determine the price of various cuts so that they on the one hand ensure as much income as possible, and on the other hand ensure that all their meat is sold. Therefore, it is the price of the meat sold, and not the quantity in kilograms, that determines how much extra production from the slaughterhouse is induced through a change in the demand for a given cut’.
CONCITO goes on to give this illustrative example of how the database can be used:
’The average climate footprint of beef from the slaughterhouse is 50.2 kg CO2e per kg, while the distribution of the climate footprint on the various cuts is between 31 kg CO2e per kg minced beef and 152 kg CO2e per kg beef tenderloin. If the choice is between, for example, 1 kg of minced beef and 1 kg of beef tenderloin, the best climate choice will be 1 kg of minced beef. If the choice is between DKK 100 for minced beef and DKK 100 for beef tenderloin, there will be no difference in the climate footprint.’
The debate on wild fish and farmed fish illustrates another core aspect of the consequential approach, namely what happens when a market is constrained.
The producer’s association for the Danish fisheries considers the climate database ‘flawed’ because it calculates the climate impact from farmed fish and not from the wild fish they actually catch, which may have a lower impact.
But CONCITO again reminds us that the purpose of the climate database is to provide information on the climate consequences of a change in demand. For fish, an increase in demand will ultimately affect fish farming, no matter if your fish is caught in the sea or comes from aquaculture. Here is the reasoning from CONCITO:
‘The results for fish are based on internationally recognized studies that show that the amount of wild-caught fish does not change. There are lots of fish in the oceans, but the market is controlled by quotas and we cannot just catch more than we do today.
Wild-caught seafood is generally a globally limited resource that cannot be increased, since the carrying capacity of the ecosystems is fully utilised in virtually all parts of the world. However, this does not apply to marine molluscs such as mussels, oysters and squid, which are found in abundant quantities.
Good fisheries management can help to increase fish stocks. However, considering that aquaculture today accounts for almost half of the world's fish production, it is difficult to see how changes in local fisheries management in the EU can make a significant difference in the global fish market.’
Several dairy and meat producers’ organisations have criticised the climate database, primarily from the point of view that it is misleading to state the climate footprint per kg of food instead of the content of nutrients. They argue that food is chosen for nutritional value, calories and nutrition – so a kilogram of cucumber and a kilogram of meat is not comparable.
CONCITO points out that the nutritional content of the food is shown in the description for each of the products in the database. However, the climate footprint per kg of food is simply the most relevant and practical measure for food choices as part of complex dishes:
‘In addition to taste and enjoyment, we eat to get full and get the necessary nutrients - not to get as many calories, proteins, etc as possible. When we need to optimize the diet in relation to climate and health, the nutritional content is not the relevant measure. For example, no one buys according to calories or proteins, and most Danes today consume too many nutrients.
Besides that, recipes and shopping lists are normally described and accounted for by the weight of the different ingredients and products – not the amount of calories, protein, etc. The typical consumer goes out to buy 1 kg of potatoes - not 20 grams of potato protein.
The climate database has as its sole purpose to put focus on the climate impact of what you put in your shopping basket or meal, not to compose a nutritionally optimal purchase or meal. For that, it is preferable to orient oneself in the Danish official dietary advice.’
With the combination of the climate database for the 500 foods and this brand new official dietary advice - where good things are said about living both climate friendly and healthy on a whole-grain and mainly plant based diet – the Danes have free access to the – also in international context - most comprehensive, detailed, consistent and transparent information on how to make climate friendly food choices.
That said – we still miss to see political action in Denmark. Because, honestly, climate problems cannot be solved by consumer choices alone.
Resource efficiency has traditionally been a key pillar of energy and broader environmental policy. This is why more efficient cars, lighting, and irrigation systems, to name a few, have been widely endorsed by both private and public management. Yet this pervasive efficiency narrative is now being challenged by the so-called rebound effect. So what is this rebound effect and how does it affect everyday choices?
Let’s assume a case where Mike and Penny want to replace their old car with a new one that is 10% more fuel efficient, believing they will save the environment a 10% energy use.
But what happens if the couple actually change their driving behavioural due to the perceived efficiency change? For example, they might now spend the resulting economic savings from reduced fuel use on other products, including additional driving. Also, their driving behaviour may change in light of their perceived ‘good deed’. Indeed, they may feel morally licensed to buy a bigger car, turn the AC more regularly, or even buy a second car (Santarius and Soland 2018). All of these indirect consequences constitute the so-called rebound effect. When a given resource efficiency measure leads to overall increased resource use, we speak of a backfire effect or the Jevon’s Paradox in relation to the seminal work by William Stanley Jevons (1865).
Estimating the rebound effect entails isolating the effect that any perceived efficiency plays on resource use. In other words, Penny and Mike would have needed to first estimate their current energy use, and then estimate which share would be attributable not just to driving the car, but to the change in efficiency of the new car with respect to the old one. Such a daunting task has led to multiple approaches and ultimately a polarised debate between those who argue that rebound effects are modest in size, easily addressed, and generally overplayed (Gillingham et al. 2013) and those who argue that the Jevon’s Paradox takes place in multiple contexts and a better understanding of rebound effects is needed to guide environmental policy worldwide. Some of us from the latter group have edited a Research Topic in Frontiers in Energy Research and Frontiers in Sociology entitled “The Rebound Effect and the Jevons' Paradox: Beyond the Conventional Wisdom” (editorial).
This special issue focuses on unconventional approaches to study rebound effects. The Research Topic includes seven theoretical works and case studies that shed new insights into the study of rebound effects: from the theories of complex adaptive systems and moral licensing to applications of system dynamics and industrial ecology models.
Dr. Tamar Makov from Yale University and I contributed a paper on rebound effects from smartphone reuse going beyond the traditional focus on energy efficiency to show how rebound effects may apply to circular economy strategies (Makov and Font Vivanco 2018). We show how imperfect substitution between recycled and new products, together with re-spending of the cost savings, could erode around one third—and potentially all—of the emission savings from smartphone reuse. Could this also apply to Penny and Mike’s car?
The special issue demonstrates the limitations of the current framing of rebound effects and show how this phenomenon has deeper roots in system behaviour, human psychology, and social organisation. The articles reinforce the argument that rebound effects are larger than many have assumed, and therefore present a critical challenge for environmental sustainability.
The critical challenge is to reconcile the economic growth with sustainability ambitions and bring the rebound effect issue into the policy arena (Font Vivanco et al. 2016a). For genuine sustainability, a good understanding of rebound effects is needed to avoid unintended consequences. I believe the life cycle-based approaches combined with tools that capture complex human and broader systemic behaviour, such as econometric (Font Vivanco et al. 2016b), quasi-experimental (Makov and Font Vivanco 2018), and macro-economic (Font Vivanco et al. 2019) tools offer untapped potential for business and governmental organisations to mitigate rebound effects and achieve their sustainability targets.
Font Vivanco, D., Kemp, R., and van der Voet, E. (2016a). How to deal with the rebound effect? A policy-oriented approach. Energy Policy, Elsevier, 94, 114–125.
Font Vivanco, D., Nechifor, V., Freire-González, J., and Calzadilla, A. (2019). Economy-wide rebound makes UK’s electric car subsidy fall short of expectations. Renewable & Sustainable Energy Reviews, (accepted).
Font Vivanco, D., Tukker, A., and Kemp, R. (2016b). Do Methodological Choices in Environmental Modeling Bias Rebound Effects? A Case Study on Electric Cars. Environmental Science and Technology, 50(20).
Gillingham, K., Kotchen, M. J., Rapson, D. S., and Wagner, G. (2013). Energy policy: The rebound effect is overplayed. Nature, Nature Publishing Group, a division of Macmillan Publishers Limited. All Rights Reserved., 493(7433), 475–476.
Jevons, W. S. (1865). The Coal Question. An inquiry concerning the progress of the nation and the probable exhaustion of our coal-mines. Macmillan and co., Cambridge, UK.
Makov, T., and Font Vivanco, D. (2018). Does the Circular Economy Grow the Pie? The Case of Rebound Effects From Smartphone Reuse. Frontiers in Energy Research, Frontiers, 6, 39. https://www.frontiersin.org/articles/10.3389/fenrg.2018.00039/full
Santarius, T., and Soland, M. (2018). How Technological Efficiency Improvements Change Consumer Preferences: Towards a Psychological Theory of Rebound Effects. Ecological Economics, Elsevier, 146, 414–424.
It will come as no surprise to regular readers of this blog that 2-0 LCA advocates a strict interpretation of the ISO 14040-series of standards for LCA to mean that a consequential modelling approach shall be used whenever the results are to be applied for decision support. Our advocacy for the consequential approach is based on its superior ability to reflect the physical and economic causality of changes in product systems.
The alternative modelling approach, which has come to be known as attributional, is nevertheless still in widespread use, even for product comparisons, supporting decisions that will shift demand between products, and to estimate the effect of increasing or decreasing system output. This points to a widespread lack of understanding of the limitations of attributional models. We have therefore spent quite some effort in explaining the difference between the two modelling approaches and their application areas.
These efforts include two recent scientific articles that contribute to solve the internal consistency problems in attributional modelling and clarify the importance of making the right choice of background data depending on the application area, based on an understanding of underlying reasons for the differences in results between the two modelling approaches.
Currently, ISO is investigating options for making amendments to overcome the largest problems in the current LCA standards. Through our national standardisation committee we have recently submitted a proposal to amend ISO 14044 on the topic of “Applications of LCA” aiming at clarifying how the requirements of the standard should be interpreted when applying each of the two approaches, both with respect to application areas, system boundaries, and co-product allocation. We urge all our readers to ask your national standardisation body to support that ISO initiates discussion on this proposed amendment.
Today, I give a keynote presentation to the “LCA Food 2016” conference in Dublin, on the topic of “Potentials and limitations of LCA for decision support”. The below figure is taken from one of my slides.
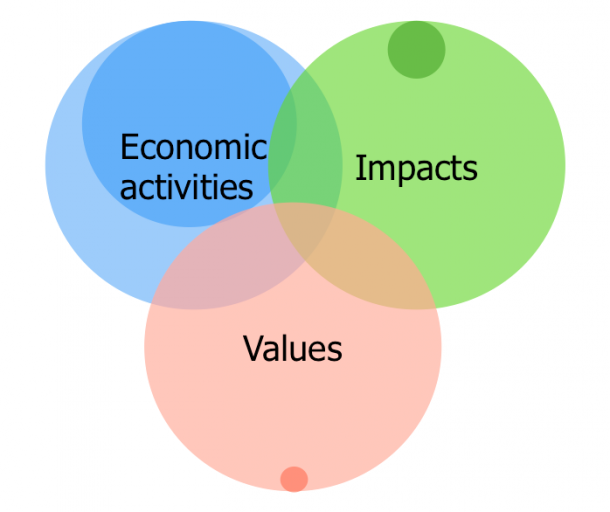
The three circles in the figure show our current knowledge, and the smaller circles within each illustrate how much of this knowledge is typically used by current LCA practice.
A wealth of knowledge is available for and from Life Cycle Assessment (LCA) as it combines three areas of knowledge:
The above considerations can be extended to cover additional aspects of data and model quality, such as the models used for linking data into product systems, the spatial detail of data, the age of the data used, the transparency of the data, the data quality indicators used, and the review procedures applied. For all of these aspects, current LCA practice leaves much to be desired.
The main question for my keynote presentation is therefore: Why is most of current LCA practice so limited?
I have three suggestions for an answer to this question:
My conclusion is that for our knowledge to be used in practice, we need to make these costs matter to LCA practitioners and decision-makers, which means that we need to become involved in the power game around decision-making.
In this power game, we must not only provide knowledge but also empowerment of those stakeholders that have the winning (more environmentally friendly) solutions but currently have too low power to have them implemented. One powerful tool in this game is to call for due diligence by the more powerful players that have the losing (less environmentally friendly) solutions. Because these players are powerful, it may be necessary to find ways to temporarily compensate their losses, to ensure that the best possible compromises can be implemented. To maintain our scientific integrity, we need to lose our political virginity.
I was recently asked to tell about the experiences we have at 2.-0 LCA consultants with consequential LCA. That question sent me on a long trip down memory lane.....
You will therefore find the format of this blog-post a bit unusual, with a ‘fat’ bibliography and a focus on our contributions to the field. I hope you will anyway find it worthwhile to read.
All practical applications of LCA are ultimately concerned with potential improvements of the analysed systems. Therefore, LCA is designed to model the physical consequences of a change, tracing the physical and economic causalities that result from a decision. This type of modelling is is often referred to as consequential LCA, as opposed to attributional modelling that a trace specific aspect of a value chain or supply chain back to its contributing unit processes, and that cannot say anything about the consequences of changing the analysed system.
The idea of LCA as a model of changes was initially suggested by Heintz & Baisnée (1992) and Weidema (1993), pointing out that to determine what processes to include in a product system, it is necessary to use information on how markets react to changes in demand and supply. The consequential modelling principles were later built into the ISO standards on LCA, published in 1998 (ISO 14040, 14044 and 14049; see Consequential-LCA 2015) and supported by a number of scientific publications, notably Weidema et al. (1999) and Weidema (2001a), and summarized in Weidema (2003a).
Due to the lack of flexible and geographically differentiated background databases, the initial application of the consequential modelling principles was limited to specific parts of the foreground systems. Examples of early applications can be found for metals (ISII 1997, Weidema 1999a, Weidema & Norris 2004), renewable materials (Weidema 1999b), electricity and nitrogen fertiliser (Weidema 2001b), and fish (Thrane 2004).
That a consistent consequential model could be implemented in a background database based on the introduction of flexible market activity datasets was put forward in Weidema (2003b) but not implemented in practice until ten years later, in the ecoinvent database (Weidema et al. 2013).
That marginal modelling is also applicable in IO-LCA (LCA using input-output data from the national accounts) was already pointed out in Nielsen & Weidema (2001) and consequential procedures to handle co-production have already long been in use in IO modelling (Stone 1961; see also the discussion of the parallel but isolated developments of IO and LCA modelling in Suh et al. 2010). This parallel model structure allows current consequential LCA practice to combine the advantages of both process-based data (high degree of detail) and IO-data (economy-wide completeness).
The increasing global trade and the corresponding availability of geographically differentiated LCA data have increased the relevance of identifying the geographical location of marginal suppliers to the global markets; see examples for aluminium (Schmidt & Thrane 2009), pulp wood (Reinhard et al. 2010), biomass production capacity (Schmidt et al. 2015).
For changes that liberate or bind scarce resources, a consistent analysis requires inclusion of the marginal rebound effects of this change in resource availability (Weidema 2008). The most well-known rebound effect is the effect of price differences that change the availability of money for alternative consumption (see Thiesen et al. 2008 for an example of how to estimate this), but also other rebound effects can be of importance; see Weidema et al. (2008) for an example of systematic inclusion of rebound effects.
Because market reactions to changes in demand and supply can lead to both increases and decreases in environmental impacts, results of consequential studies may often be unexpected and counterintuitive compared to a more static analysis that ignore such market reactions. Examples of such initially counterintuitive and possibly even controversial findings are that:
When specific data used in a consequential model are counterintuitive, controversial, or particularly important for the outcome of the analysis, the requirements to documentation of the data acquisition increases, and additional efforts and techniques may be required for data acquisition, for example the use of equilibrium models to identify the specific farm types that provide the marginal supply of different agricultural products (Jensen & Andersen 2003), and exhaustive uncertainty assessment (Weidema 2011).
Examples of companies that put particular emphasis on open and transparent reporting of the assumptions and data used are Novozymes (see Weidema & Wesnæs 2005, Wesnæs & Weidema 2006) and Arla Foods (Dalgaard et al. 2016). Examples of very structured and well-documented applications of the consequential procedures are Schmid t (2015) for the identification of the determining output of five oil crops and Schmidt et al. (2011) for country-specific consequential electricity mixes. Sharing well-documented consequential data has become easier with the recent availability of the community website consequential-lca.org.
References
Consequential-LCA (2015). The ISO 14040 standards for consequential LCA. http://consequential-lca.org/clca/why-and-when/the-iso-14040-standards-for-consequential-lca/
Dalgaard R, Schmidt J H, Flysjö A (2014). Generic model for calculating carbon footprint of milk using four different LCA modelling approaches. Journal of Cleaner Production 73:146‑153 https://lca-net.com/p/580
Dalgaard R, Schmidt J H, Cenian K (2016). Life cycle assessment of milk ‐ National baselines for Germany, Denmark, Sweden and United Kingdom 1990 and 2012. Arla Foods, Aarhus, Denmark https://lca-net.com/p/2324
Heintz B, Baisnée P-F. (1992). System boundaries. Pp 35-52 in SETAC-Europe: Life-cycle assessment. Brussels: SETAC. (Report from a workshop in Leiden, 1991.12.02-03).
IISI (1997). Methodology report [of the IISI LCI study]. Brussels: International Iron and Steel Institute.
Jensen JD and Andersen M (2003). Marginale producenter af udvalgte landbrugsprodukter. FØI Working paper no. 08/2003 (in Danish). https://curis.ku.dk/ws/files/135447941/8.pdf.pdf
Nielsen A M, Weidema B P (2001). Input/Output-analysis – Shortcut to life cycle data? Proceedings of a workshop held in Copenhagen on the 29th of September 2000. Copenhagen: Danish Environmental Protection Agency. (Environmental Project 581) https://lca-net.com/p/1125
Reinhard J, Weidema B P, Schmidt J H. (2010). Identifying the marginal supply of pulp wood. Aalborg: 2.-0 LCA consultants. https://lca-net.com/p/198
Schmidt J H. (2015). Life cycle assessment of five vegetable oils. Journal of Cleaner Production 87:130‑138. https://lca-net.com/p/1719
Schmidt J H, Brandão M (2013). LCA screening of biofuels – iLUC, biomass manipulation and soil carbon. This report is an appendix to a report published by the Danish green think tank CONCITO on the climate effects from biofuels: Klimapåvirkningen fra biomasse og andre energikilder, Hovedrapport (in Danish only). CONCITO, Copenhagen. https://lca-net.com/p/227
Schmidt J, Thrane M. (2009). Life cycle assessment of aluminium production in new Alcoa smelter in Greenland. Grønlands Hjemmestyre. https://lca-net.com/p/183
Schmidt J H, Merciai S, Thrane M, Dalgaard R (2011). Inventory of country specific electricity in LCA – Consequential and attributional scenarios. Methodology report v2. 2.‑0 LCA consultants, Aalborg, Denmark. https://lca-net.com/p/212
Schmidt J H, Weidema B P, Brandão M (2015). A framework for modelling indirect land use changes in life cycle assessment. Journal of Cleaner Production 99:230‑238 https://lca-net.com/p/1863
Stone, R. 1961. Input-output and national accounts. Paris: Organization for European Economic Cooperation.
Suh S, Weidema B P, Schmidt J H, Heijungs R. (2010). Generalized Make and Use Framework for Allocation in Life Cycle Assessment. Journal of Industrial Ecology 14(2):335-353. https://lca-net.com/p/200
Thiesen J, Christensen T S, Kristensen T G, Andersen R D, Brunoe B, Gregersen T K, Thrane M, Weidema B P. (2008). Rebound Effects of Price Differences. International Journal of Life Cycle Assessment 13(2):104-114. https://lca-net.com/p/169
Thrane M (2004b): Energy consumption in the Danish fishery – Identification of key factors. Journal of Industrial Ecology 8, 223–239.
Weidema B P. (1993). Market aspects in product life cycle inventory methodology. Journal of Cleaner Production 1(3-4):161-166.
Weidema B P (1999a). A reply to the aluminium industry: Each market has its own marginal. Letter to the Editor responding to previously published article on Marginal production technologies for LCI's. International Journal of Life Cycle Assessment 4(6):309‑310 https://lca-net.com/p/1184
Weidema B P. (1999b). System expansions to handle co-products of renewable materials. Pp. 45-48 in Presentation Summaries of the 7th LCA Case Studies Symposium. Brussels: SETAC-Europe. https://lca-net.com/p/1186
Weidema B P. (2001a). Avoiding co-product allocation in life-cycle assessment. Journal of Industrial Ecology 4(3):11-33. https://lca-net.com/p/1142
Weidema B P. (2001b). Two cases of misleading environmental declarations due to system boundary choices. Presentation for the 9th SETAC Europe LCA Case Studies Symposium, Noordwijkerhout, 2001.11.14-15. https://lca-net.com/p/1131
Weidema B P. (2003a). Market information in life cycle assessment. Copenhagen: Danish Environmental Protection Agency. (Environmental Project no. 863). https://lca-net.com/p/1078
Weidema B P. (2003b). Flexibility for application. Market modelling in LCI databases. Presentation for International Workshop on LCI-Quality, Karlsruhe, 2003.10.20-21. https://lca-net.com/p/1082
Weidema B P. (2008). Rebound effects of sustainable production. Presentation to the "Sustainable Consumption and Production" session of the conference "Bridging the Gap; Responding to Environmental Change - From Words to Deeds", Portorož, Slovenia, 2008.05.14-16. https://lca-net.com/p/175
Weidema B P (2011). Uncertainty reduction in consequential LCA models. Presentation for the Life Cycle Assessment XI (LCA XI) Conference, Chicago, 2011.10.4‑6. https://lca-net.com/p/208
Weidema B P (2013). Reducing impacts of forestry – the fallacy of low-intensity management. Presentation for 6th International Conference on Life Cycle Management, Gothenburg 2013.08.25‑28. https://lca-net.com/p/229
Weidema B P, Norris G A. (2004). Avoiding co-product allocation in the metals sector. Pp. 81-87 in A Dubreuil: "Life Cycle Assessment and Metals: Issues and research directions." Pensacola: SETAC. (Proceedings of the International Workshop on Life Cycle Assessment and Metals, Montreal, Canada, 2002.04.15-17). https://lca-net.com/p/1042
Weidema B P, Wesnæs M (2005). Marginal production routes and co-product allocation for alcoholetoxylate from palm oil and palm kernel oil (zip-file). Study for Novozymes. Copenhagen: 2.‑0 LCA consultants. https://lca-net.com/p/1028
Wesnæs M, Weidema B P (2006). Long-term market reactions to changes in demand for NaOH. Study for Novozymes. Copenhagen: 2.‑0 LCA consultants. https://lca-net.com/p/1014
Weidema B P, Frees N, Nielsen A-M. (1999). Marginal Production Technologies for Life Cycle Inventories. The International Journal of Life Cycle Assessment 4(1):48-56. https://lca-net.com/p/1188
Weidema B P, Wesnæs M, Hermansen J, Kristensen T, Halberg N (2008). Environmental improvement potentials of meat and dairy products. Eder P & Delgado L (eds.) Sevilla: Institute for Prospective Technological Studies. (EUR 23491 EN). https://lca-net.com/p/171
Weidema B P, Bauer C, Hischier R, Mutel C, Nemecek T, Reinhard J, Vadenbo C O, Wernet G (2013). Overview and methodology. Data quality guideline for the ecoinvent database version 3. Ecoinvent Report 1(v3). St. Gallen: The ecoinvent Centre. https://lca-net.com/p/234
- The case of electricity mixes in consequential LCA
Have you ever doubted what to include in your technology mixes? What happens when a technology is dominating the mix of today, but we know that the technology will be phased out and reduced in the future?
To an extent the answer depends on your study. But the studies we perform are for decision support, where our clients need to understand the environmental impacts of a change in demand for the product under study. For such studies we need a consequential approach - a modelling approach in which activities in a product system are linked so that all activities that are expected to change are included.
At the core of the consequential LCA are the marginal suppliers. They are defined as the ones being installed as a consequence of a change in demand (in increasing and stable markets, which is the general case for most products). You can read more details about marginal suppliers at www.consequential-lca.org.
Here, let us look at a concrete example. In our Energy Club we developed consequential LCIs on electricity for more than 20 different countries and regions (contact us for availability of these data). In these LCIs we base the identification of the marginal suppliers on the above reasoning. So the marginal electricity suppliers are those that are predicted to increase their installed capacity. The only exception is when they are constrained. That could be by a dependence on an input of a waste or by‐product or if the increase is fixed by legislation or other factors not related to changes in demand. Technologies with declining trends are not regarded as being part of the marginal.
For instance, we found that the suppliers in Denmark that are predicted to increase capacity are wind and biomass; while coal is a decreasing (old) technology. This means that wind and biomass are marginal, while coal is not part of the marginal. See the figure below.
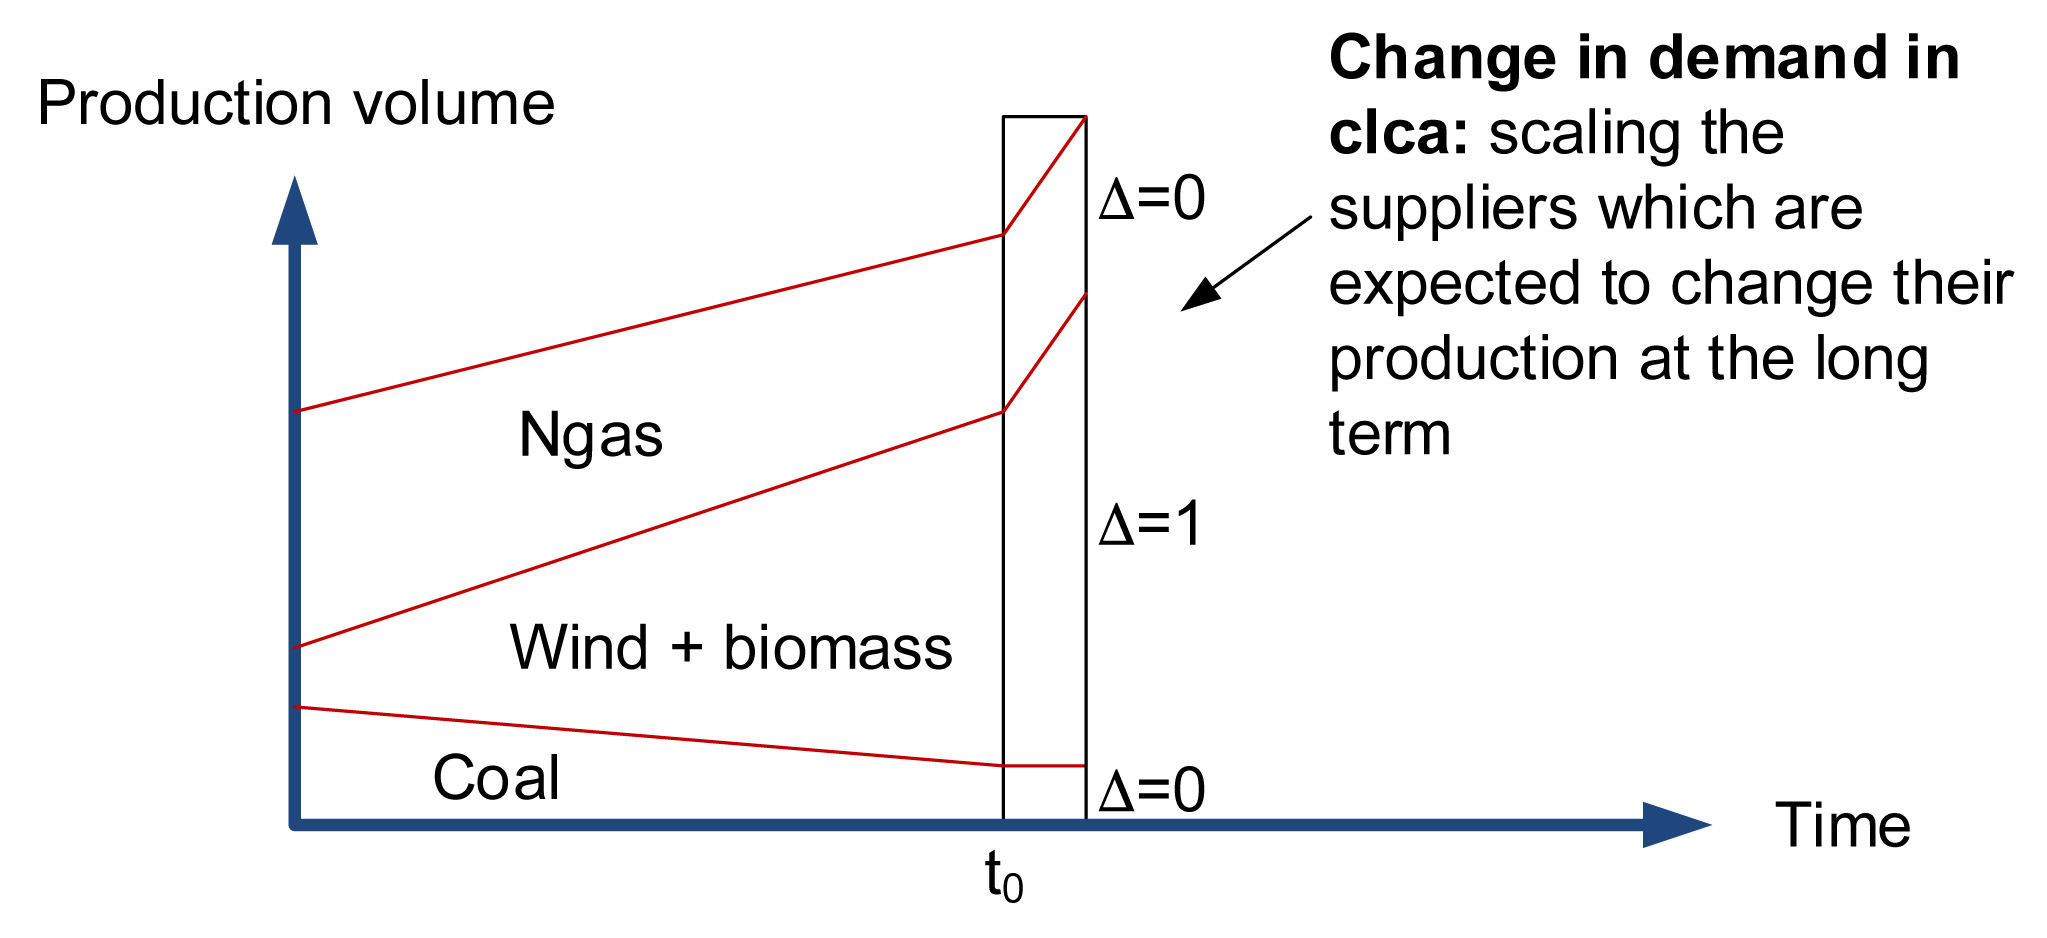
Any timing of the phasing out of technologies, such as coal, can provide a little flexibility and thereby make it a small part of the marginal, but never a significant part. Situations with flexibility could be:
‐ When there is a significant amount of overcapacity of the old technology
‐ In very short periods of time, to solve short‐term (quarters of years to entire years) need for capacity.
But still the shrinking technology will never dominate the marginal. This is because the timing of the phase out of old technologies is predominantly determined by other factors than changes in demand. These other factors include the life time/replacement rate of the technology as well as the economic performance compared to the new technologies that are installed.
Reference:
Muñoz I, Schmidt J H, de Saxcé M, Dalgaard R, Merciai S (2015), Inventory of country specific electricity in LCA ‐ consequential scenarios. Version 3.0. Report of the 2.‐0 LCA Energy Club. 2.-0 LCA consultants, Aalborg
In the discussion on the differences between attributional and consequential modelling for Life Cycle Assessment (LCA), it is a common misunderstanding that consequential modelling requires scenario modelling or other form of forecasting, and therefore should be more uncertain than attributional models based on average, allocated data from the recent past.
In their pure form, attributional models do not intend to say anything about the future, but it is still very common to find them applied to support claims about what is the best action to take to reduce future environmental impacts. One argument used to defend this (mis)use is the uncertainty argument.
In reality, both consequential and attributional models can be based on data from the recent past:
In this way, consequential models that seek to identify the here and now consequences of decisions do not need any more assumptions (or more uncertain data) than do attributional models.
If dealing with issues further into the future, both attributional and consequential models would benefit from scenario modelling or other forms of forecasting, because future average behaviour, as well as future marginal changes, are different from those that can be predicted by extrapolating data from the recent past.
But when choosing forecasting techniques, there is no reason to believe that a precise linear extrapolation of the past average is a better model of the future than a less precise, but more accurate, consequential model. I have tried to illustrate this graphically here:
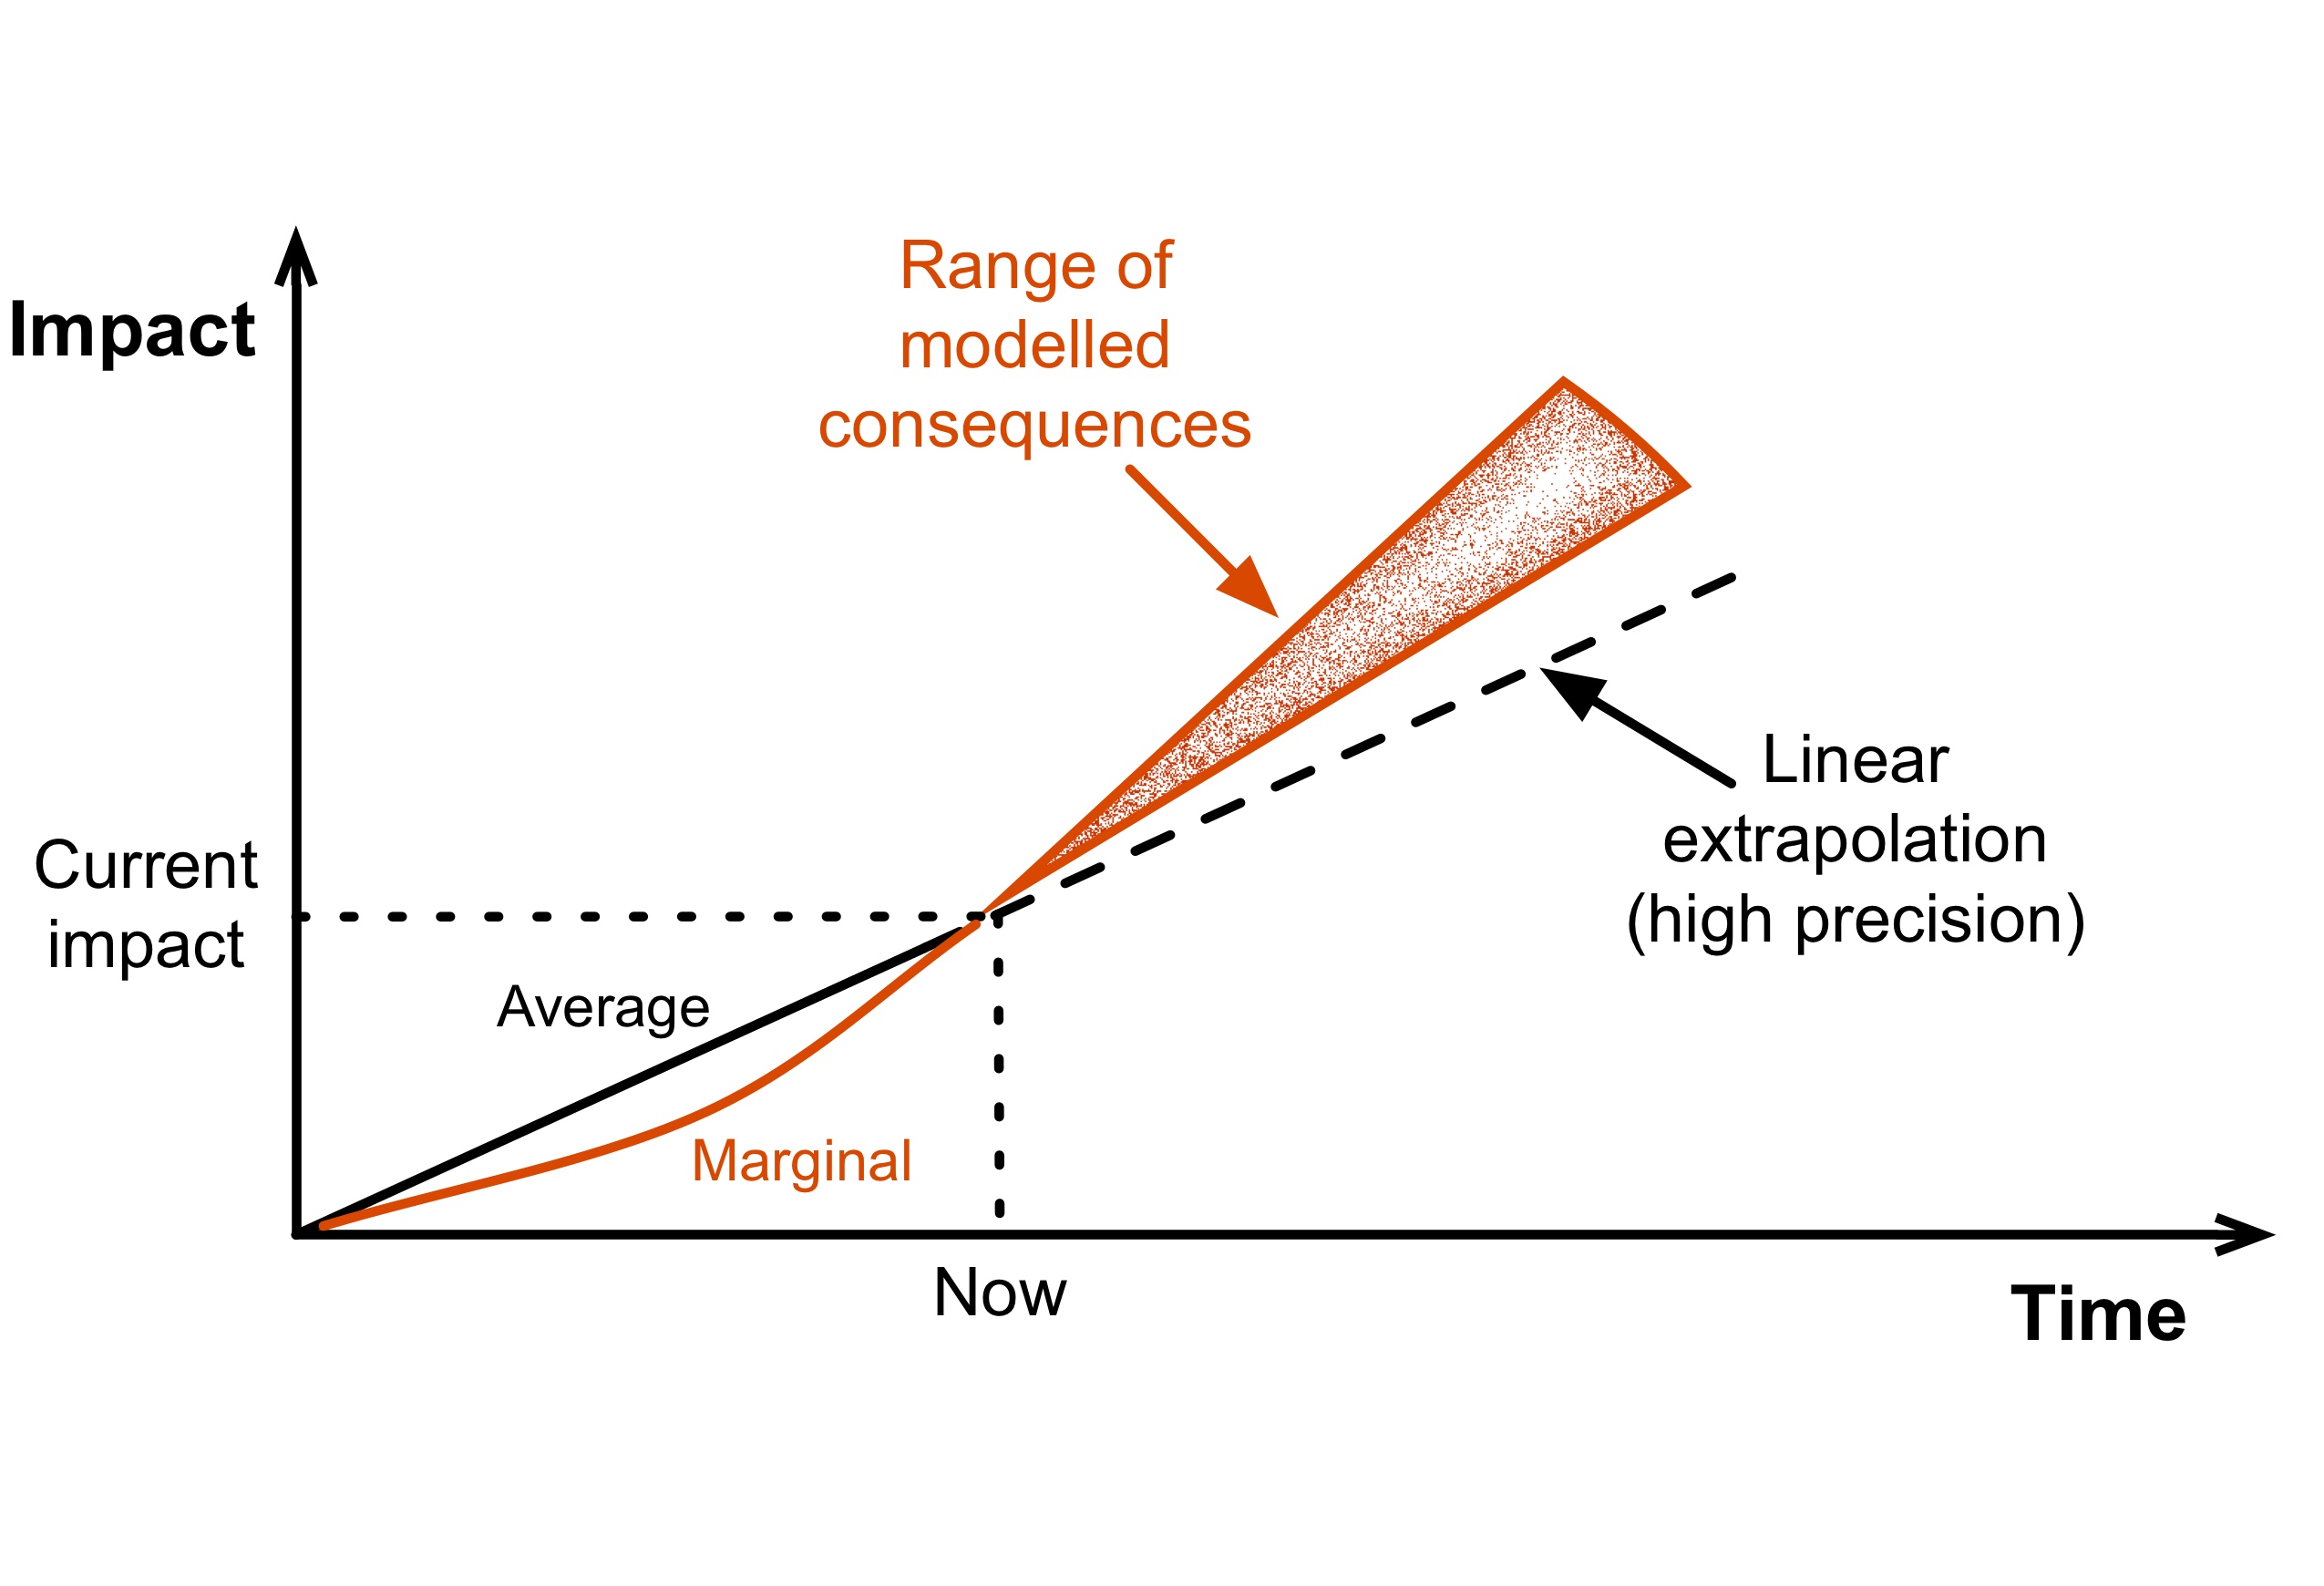 For more details on the consequential modelling and the differences to attributional modelling, see consequential-lca.org
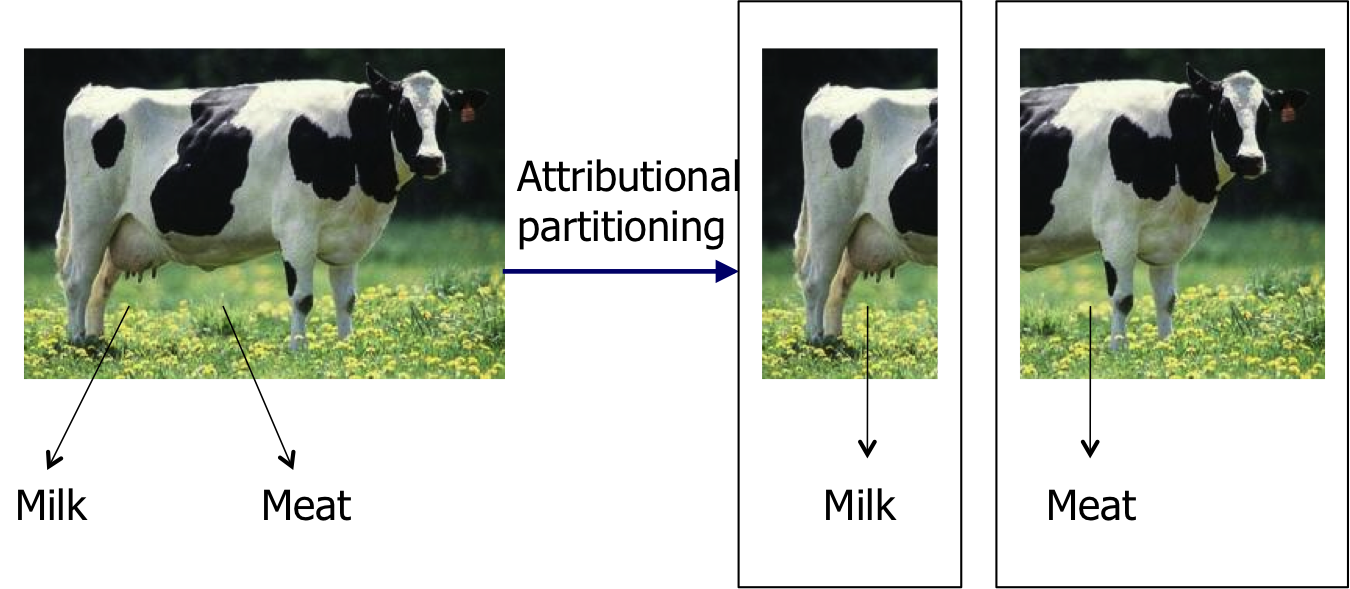
When producing a product footprint – or life cycle assessment (LCA) result – we want it as far as possible to be useful for decision support. Therefore, the way we model the product systems should maintain mass, energy and monetary balances intact, fully reflecting physical and economic causalities, based on empirical relations rather than normative assumptions and arbitrary cut-offs. This also implies avoiding allocation (partitioning) of systems with joint production of co-products, since this is an inherently normative procedure that cuts off part of a product system and therefore can provide misleading results.
To avoid allocation of systems with joint production, we use a procedure that the ISO 14044 standard on LCA calls “system expansion”. This makes it sound like something was missing in the original system and that a lot of additional work may be involved. But this is not the case.
When the text of the ISO 14044 standard was originally drafted, before the turn of the century, procedures for LCA were not as developed as they are now. Product systems were manually created using foreground data to painstakingly describe flows to and from nature for each unit process in the product system. Cut-offs were needed due to lack of data or time. In this context, the term “system expansion” appeared natural for describing the inclusion of modelling of the further fate of the by-products and wastes and the resulting changes (substitutions) in the product system, as opposed to cutting them off by allocation.
Today we have environmentally extended input-output (I/O) databases based on national statistics that cover the entire global economy. Our product systems are therefore inherently complete from the outset. When we perform “system expansion”, we therefore do not actually expand the product system, but simply follow the fate of the by-products and wastes within the already complete system, accounting for the increase in treatment activities and decrease of the upstream activities that supply the same markets as the useful by-products. The only manual work left today is to ensure the correct distinction between the products that determine the volume of the joint production and the by-products for which we must ensure that they are correctly linked to the markets where the substitution occurs. More details and examples of this can be found at www.consequential-lca.org.
The term “system expansion” is therefore no longer appropriate for what we do in practice, and we therefore tend to rather use the more general and neutral term “substitution” for this procedure. This is in accordance with the way “system expansion” was described in the original ISO text, as explained by Bo Weidema in a previous blog post.
I often hear (or read) statements like “Attributional LCA is accounting for the total emissions from the processes and material flows used during the life cycle” which shows a lack of understanding for the large parts of the life cycles that are actually ignored in attributional LCA.
Attributional LCA uses normative cut-off rules and allocation to isolate the investigated product system from the rest of the World. And by this, it ignores a lot of the physical and economic causalities that are related to the life cycle of a product.
The below video (a simple slide-show) explains three of the issues that are included in consequential life cycle models, while not being included in attributional LCA (double-click for full screen mode).
For more information see: consequential-lca.org
In what was announced as a celebration of the first 3 LCA guidelines for feed, small ruminants and poultry (http://www.fao.org/partnerships/leap/en/ ) of the FAO LEAP Partnership, I had to play the role of the party spoiler. Practically all the speakers talked about how these new guidelines would allow the identification of hotspots and options for improvement. At the same time it was made quite clear that the guidelines are for attributional LCA, explicitly excluding consequential modelling. Therefore I had to point out that as long as you limit yourself to an attributional approach, where you cut-off (e.g. by allocation) a part of the affected systems, these guidelines cannot be used to consistently identify improvement options. For example, if you by allocation isolate the milk from dairy farming from the meat, you may reach the conclusion (as one presenter showed) that intensification of dairy farming is environmentally beneficial. With a consequential approach, that includes all the real-life effects in the system, you are likely to reach the opposite conclusion, because of the important role of the displaced meat production. So if you really want to take serious all the fine words used to present the 3 guidelines (science-based, consistent and focussed on continuous improvement), your guidelines should support consequential modelling.
Luckily, my caustic words were met by broad agreement to the current limitations of the FAO guidelines, and a promise that there will be a second round that will look at the possibility to provide guidelines that address the LCA methods needed for decision support for improvements, in accordance with the ISO 14040 series of standards.
See also my blog on FAO LEAP from July 2014.