

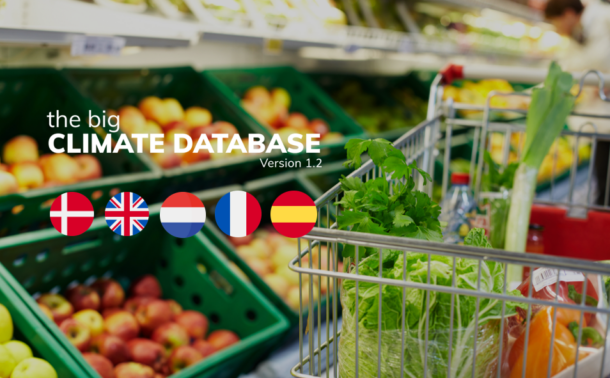
Today we're launching a new an improved version 1.2 of The Big Climate Database.
In 2021 2.-0 LCA consultants and the Danish green thinktank CONCITO launched The Big Climate Database. It provided food industry professionals and consumers with freely accessible and transparent information about the climate impact of 500 common foods on the Danish market.
In January 2024 it was updated and expanded to 503 foods and launched in a version for the UK market.
Now, we’re adding results for the Netherlands, France, and Spain and expanding the database with 37 new food items.
Version 1.2 of The Big Climate Database includes regionalized data at the retail level for the Danish, British, Dutch, French, and Spanish markets and now contains the average climate impact of a total of 540 foods.
Regionalized means, that the climate impact of a French baguette or a Spanish Iberico ham will have the specific climate impact of the food purchased in a French or Spanish supermarket, including all emissions up to the point of purchase. This gives the data unique accuracy and flexibility.
Data for all included countries, the technical details behind the database, and the more than 17,000 underlying datasets are freely available at the new website:
www.thebigclimatedatabase.com.
The most significant changes compared to version 1.1 for the Danish and British markets are due to an updated and detailed model of fertilizer production and for calculating greenhouse gases from indirect changes in land use.
These changes (among many others), mean that the climate impact for all products has increased by an average of about 9%. For 33 foods, the climate impact has increased by more than 20%, while for 176, it has decreased from version 1.1 to 1.2.
This update of The Big Climate Database was carried out and financed by us at 2.-0 LCA consultants, and we’ll continue to improve the datasets behind it and will add more countries and products in the coming years.
Version 1.2 for the Danish market is available as a downloadable version at denstoreklimadatabase.dk, which is managed by CONCITO with targeted information for Danish users of the climate database. The web table will be updated shortly.
The Big Climate Database was launched in 2021 by CONCITO in collaboration with 2.-0 LCA consultants and with support from the Salling Foundations.
The Big Climate Database was awarded the Nordic Council's Environmental Prize in 2021 for the project's significant changemaking potential.
Version 1.1 was launched in January 2024 with updates and corrections, including the addition of average climate footprints for beef, pork, and chicken, as well as a version for the UK market. The update was released by CONCITO in collaboration with 2.-0 LCA consultants and funded by the prize money from the Nordic Council's Environmental Prize. The UK market version was financed by Zedible.
Version 1.2, with results for Denmark, England, the Netherlands, France, and Spain, and 540 food products, was carried out and funded by 2.-0 LCA consultants. The results, the underlying datasets, and the methodology report are available at thebigclimatedatabase.com.
We have developed a new LCA calculator that gives members of the Danish horticultural industry the opportunity to calculate the CO2 equivalents and several other environmental impacts from their own production. The intended application for our client, Danish Horticulture (Dansk Gartneri), was to identify impacts and hotspots and use the outcome to substantiate their ongoing work on reducing the impacts from the Danish horticultural production. The tool is prepared for both organic and conventional cultivation practices.
The horticulture-specific calculator includes emissions for the production and upstream in the life cycle, including relevant processing and packaging. Results are given per ton crop at the green house gate. The calculator is simple to use and thus allows each horticultural producer to focus on communicating their impacts and to identify their possible improvement potentials.
To highlight this new option and the functions of the tool, I wrote an article (CO2-beregner for gartnerier) for the printed Danish industry magazine, Gartner Tidende. You can read more about this project in English on our project page.
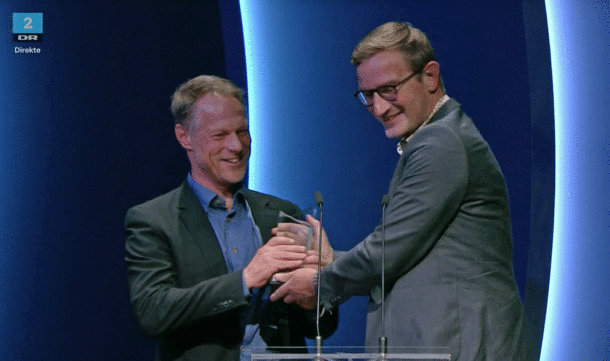
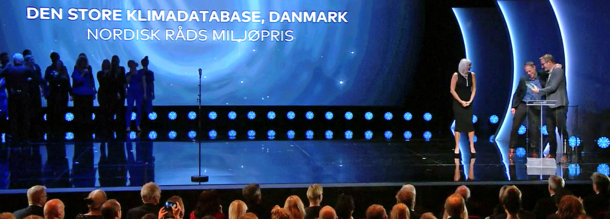
Our CEO, Jannick Schmidt, was invited on stage together with programme manager Michael Minter at yesterday’s prize show in Copenhagen’s Skuespilhuset to accept the Nordic Council Environment Prize 2021 for the "The Big Climate Database"! It is not often that great data attracts such limelight – but that happened last night.
The Big Climate Database was developed by us for the Danish Think Tank CONCITO with funding from the Salling foundations and has catalogued 500 of the most common foods in Denmark and calculated their CO2 footprint. We are so pleased that the Danish Think Tank CONCITO was honoured for their forward-thinking project.
In 2019 the award was won by Greta Thunberg for calling us to action.
Now it is time to get the right data out to people to substantiate their actions.
You can read the jury's motivation in English here:
https://www.norden.org/en/news/concito-denmarks-green-think-tank-wins-2021-nordic-council-environment-prize
Yesterday marked the release of a new strategy from Arla Foods launching their targets to accelerate the transition to sustainable dairy production.
The new strategy has an increased focus on the farms and we are pleased to see how our climate tool has now been applied to 5000 individual farms. The tool calculates climate footprints for the milk from each farm and thus demonstrates to the farmer where the CO2 emissions originate.
The numbers are a motivation in themselves, and often climate ’savings’ may also entail cost savings according to Jan Toft Nørgaard, a milk producer himself and chairman of Arla Foods.
In the project for Arla we have calculated climate footprint since 1990 and the Arla farmers have reduced their emissions per kilogram of milk by 24 %. The current average for the Arla farmers in the study is an emission intensity of 1.15 kg CO2 per kilogram of milk, which is approx. half of the global average, which is 2.5 kg CO2 (according to FAO).
Links to more information:
Arla press release (in Danish): https://www.arla.dk/om-arla/nyheder/2019/pressrelease/fremtidens-mejeriprodukter-skal-vaere-klima-neutrale-2845584/
Our project with ARLA is described in more detail here: https://lca-net.com/projects/show/carbon-footprint-milk/
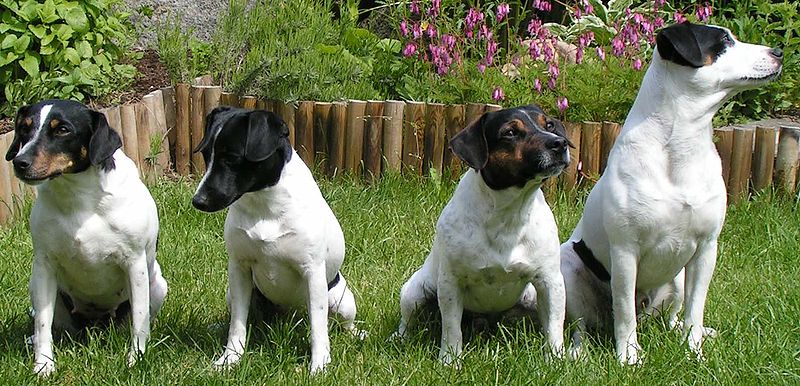
The dog is said to be man’s best friend, but is it a climate enemy?
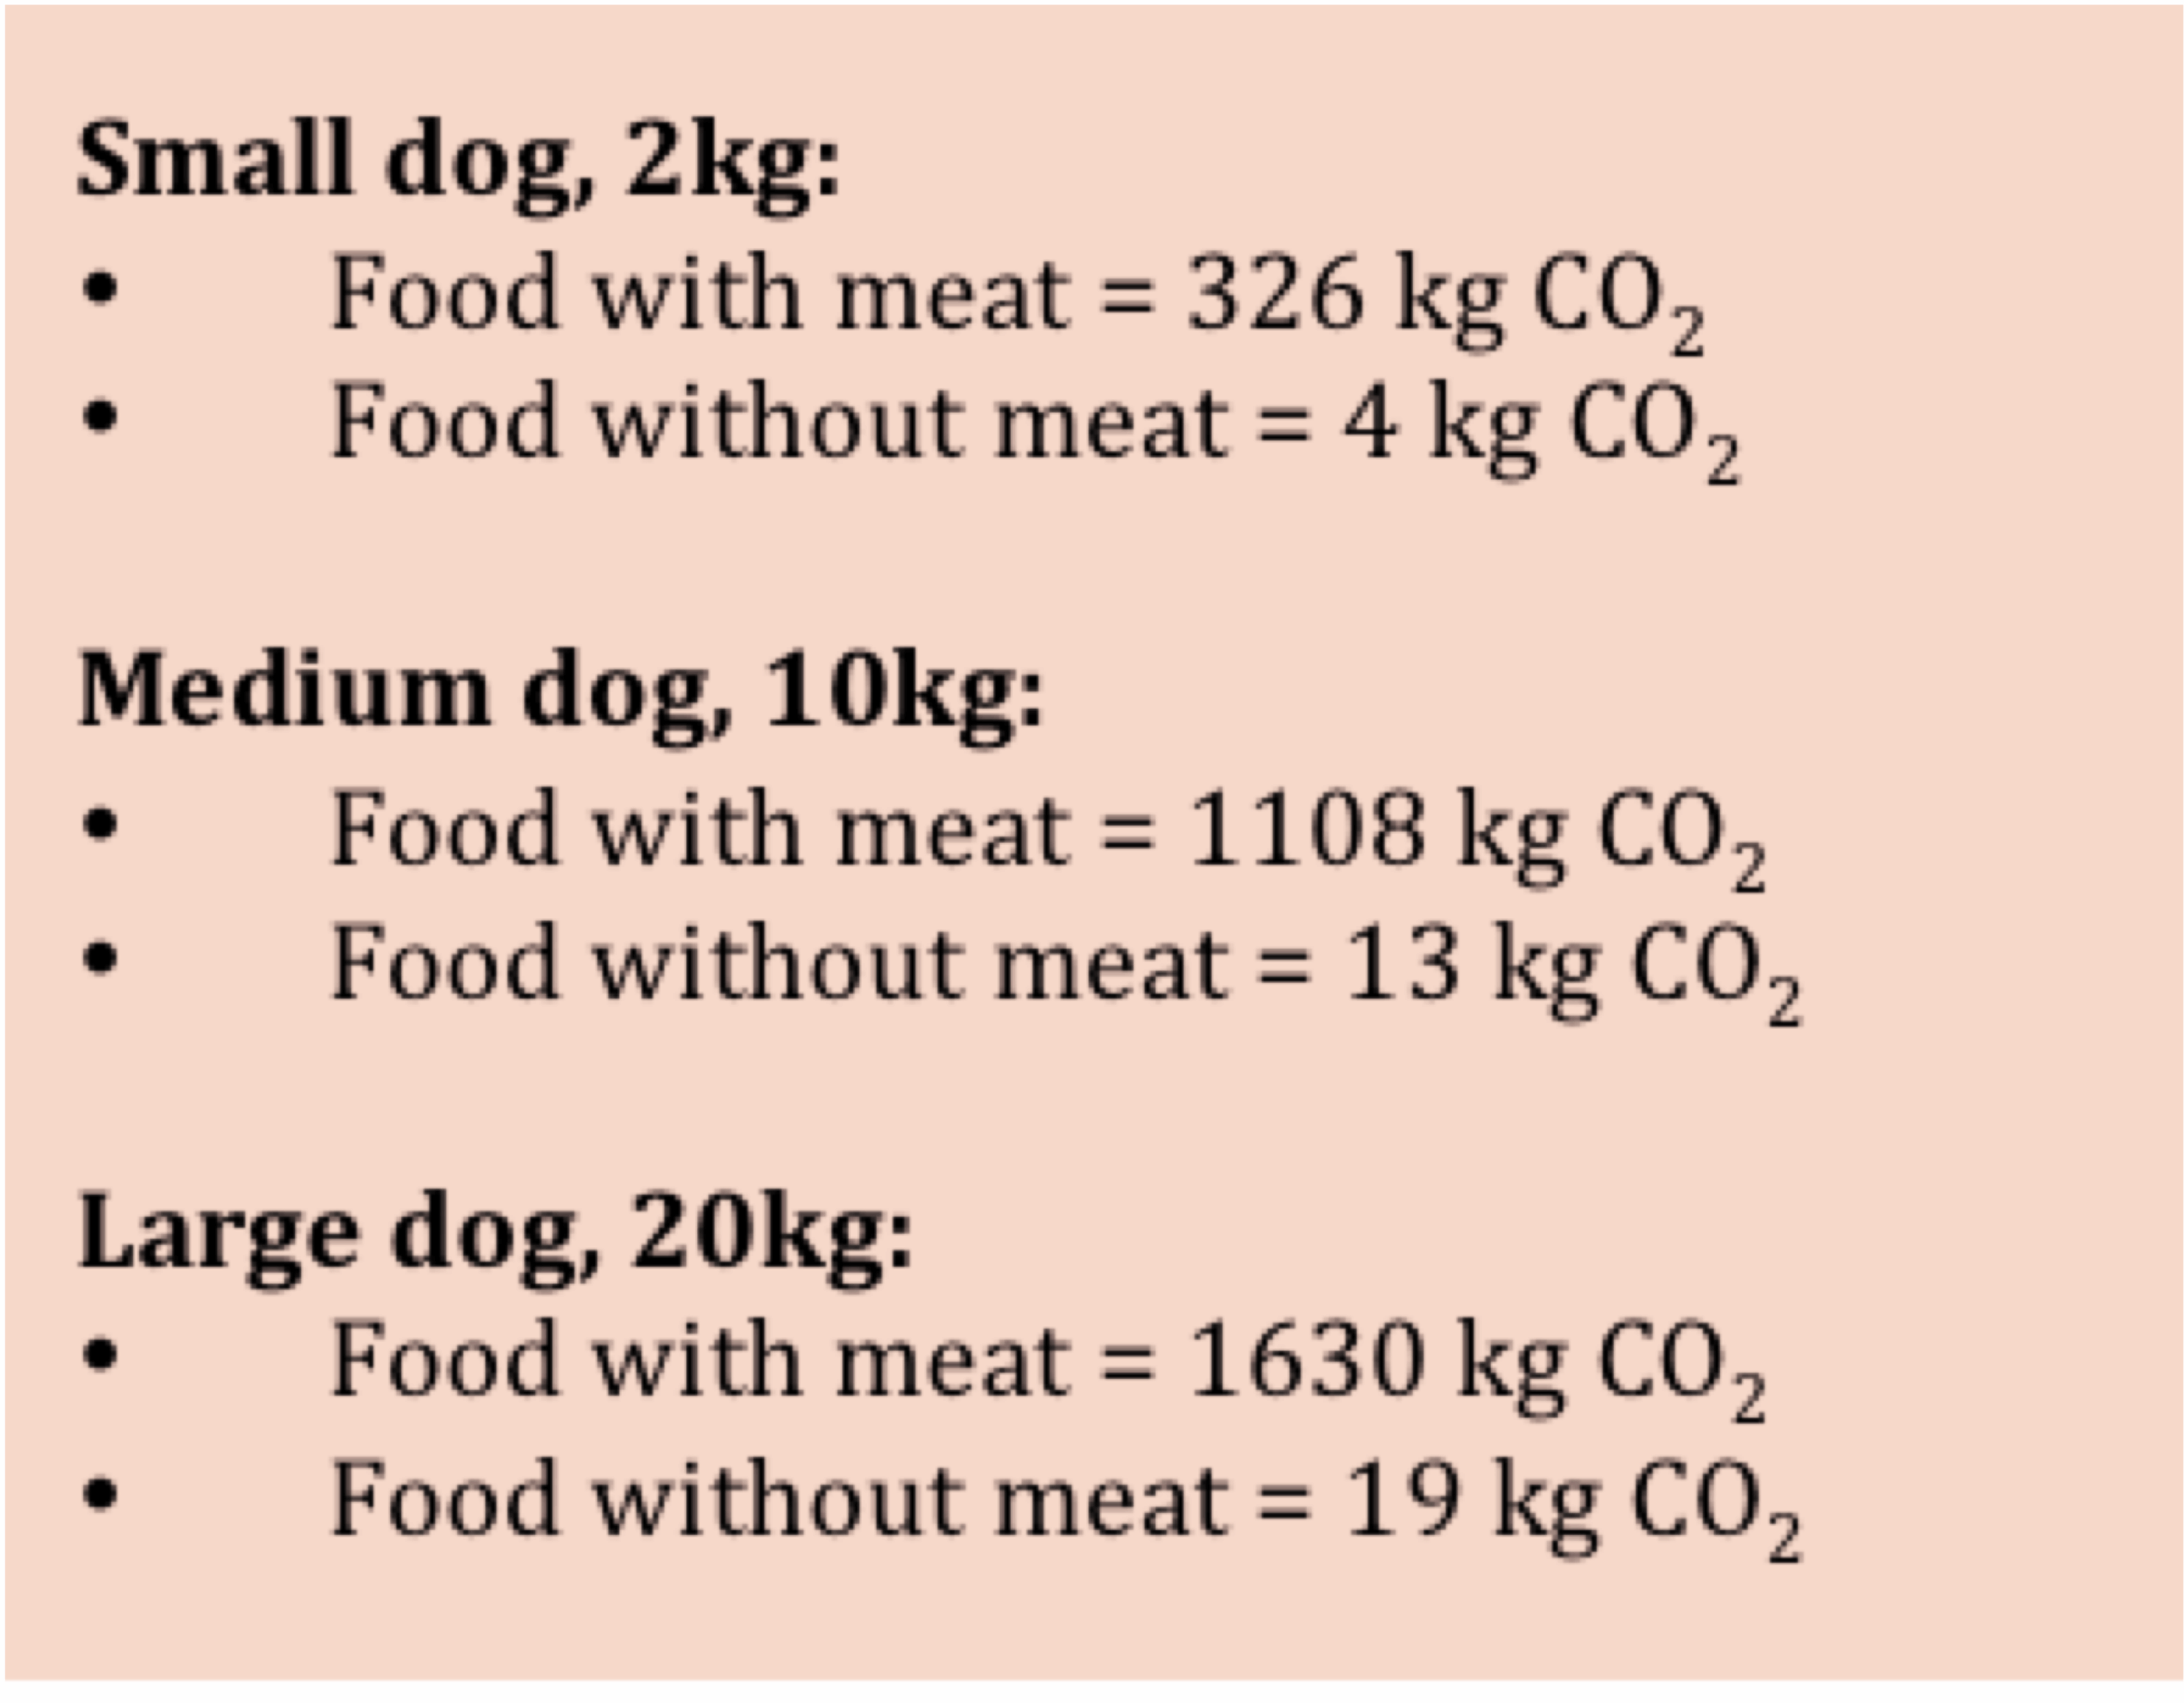
Dogs and cats are as fond of meat as are their owners. And therefore their CO2 emissions make up a substantial part of their owners emission totals. In fact, our calculation shows that a 10 kilo dog like the ones below on average emits up to 1.1 tonnes of CO2 annually, mainly through their meat consumption.
Last week I was called in as an expert for a radio programme: P1 – ‘Your dog, the climate enemy’. This segment is part of a series, ‘The climate testament’, that addresses climate issues and what each of us can do to alleviate some of the problems we face today.
The largest and most obvious problem with cats and dog lies with their meat consumption. As meat is produced, we see both land use effects and various greenhouse gas emissions, since the conversion from plant to animal protein is very inefficient, esp. for the bigger animals like pigs and cows.
For the radio programme, I had calculated emissions for three different dog sizes and I compared these to driving a car, where the emissions from small dog is equivalent to driving up to 1000 km in a average Danish car, while the big dog equals up to 5200 km driven, provided the dogs eat meat. I based these rough and average calculations on the current dietary recommendations for each of the weight classes given by professor Charlotte Bjørnvad. Bjørnvad is a professor in Internal Medicine at Department of Veterinary Clinical and Animal Sciences, University of Copenhagen.
Luckily for the environmentally conscious pet owner, Bjørnvad explained that a conversion to a more climate neutral diet is possible.
Dogs have had a long co-evolution with humans, eating the leftovers from our table. So in spite of their wolf ancestry, they can now thrive on a vegetarian diet. This is also a consequence of breeding, with all the genetic changes that this entails. Charlotte Bjørnvad explained how we could give them a protein base from e.g. beans combined with eggs, but let their main energy come from carbohydrates. In fact, a dog’s digestive system can handle carbohydrates and fibres from vegetables, provided they are heat-treated, just as is the case for humans.
So there is now enough knowledge to suggest it is safe to switch to a vegetarian diet for our canine friends. For cats, it remains a bit more tricky – a suggestion in the programme was to include insects as a source of animal protein for the cats, since they need a wider range of animal proteins in their diet, compared to both humans and dogs.
So starting from a rather polemic initial question; we arrived safely at the end of the radio programme at a solution that can be directly implemented in your dogs food bowl – next step is to push the pet food market in the right direction.
I was recently asked to tell about the experiences we have at 2.-0 LCA consultants with consequential LCA. That question sent me on a long trip down memory lane.....
You will therefore find the format of this blog-post a bit unusual, with a ‘fat’ bibliography and a focus on our contributions to the field. I hope you will anyway find it worthwhile to read.
All practical applications of LCA are ultimately concerned with potential improvements of the analysed systems. Therefore, LCA is designed to model the physical consequences of a change, tracing the physical and economic causalities that result from a decision. This type of modelling is is often referred to as consequential LCA, as opposed to attributional modelling that a trace specific aspect of a value chain or supply chain back to its contributing unit processes, and that cannot say anything about the consequences of changing the analysed system.
The idea of LCA as a model of changes was initially suggested by Heintz & Baisnée (1992) and Weidema (1993), pointing out that to determine what processes to include in a product system, it is necessary to use information on how markets react to changes in demand and supply. The consequential modelling principles were later built into the ISO standards on LCA, published in 1998 (ISO 14040, 14044 and 14049; see Consequential-LCA 2015) and supported by a number of scientific publications, notably Weidema et al. (1999) and Weidema (2001a), and summarized in Weidema (2003a).
Due to the lack of flexible and geographically differentiated background databases, the initial application of the consequential modelling principles was limited to specific parts of the foreground systems. Examples of early applications can be found for metals (ISII 1997, Weidema 1999a, Weidema & Norris 2004), renewable materials (Weidema 1999b), electricity and nitrogen fertiliser (Weidema 2001b), and fish (Thrane 2004).
That a consistent consequential model could be implemented in a background database based on the introduction of flexible market activity datasets was put forward in Weidema (2003b) but not implemented in practice until ten years later, in the ecoinvent database (Weidema et al. 2013).
That marginal modelling is also applicable in IO-LCA (LCA using input-output data from the national accounts) was already pointed out in Nielsen & Weidema (2001) and consequential procedures to handle co-production have already long been in use in IO modelling (Stone 1961; see also the discussion of the parallel but isolated developments of IO and LCA modelling in Suh et al. 2010). This parallel model structure allows current consequential LCA practice to combine the advantages of both process-based data (high degree of detail) and IO-data (economy-wide completeness).
The increasing global trade and the corresponding availability of geographically differentiated LCA data have increased the relevance of identifying the geographical location of marginal suppliers to the global markets; see examples for aluminium (Schmidt & Thrane 2009), pulp wood (Reinhard et al. 2010), biomass production capacity (Schmidt et al. 2015).
For changes that liberate or bind scarce resources, a consistent analysis requires inclusion of the marginal rebound effects of this change in resource availability (Weidema 2008). The most well-known rebound effect is the effect of price differences that change the availability of money for alternative consumption (see Thiesen et al. 2008 for an example of how to estimate this), but also other rebound effects can be of importance; see Weidema et al. (2008) for an example of systematic inclusion of rebound effects.
Because market reactions to changes in demand and supply can lead to both increases and decreases in environmental impacts, results of consequential studies may often be unexpected and counterintuitive compared to a more static analysis that ignore such market reactions. Examples of such initially counterintuitive and possibly even controversial findings are that:
When specific data used in a consequential model are counterintuitive, controversial, or particularly important for the outcome of the analysis, the requirements to documentation of the data acquisition increases, and additional efforts and techniques may be required for data acquisition, for example the use of equilibrium models to identify the specific farm types that provide the marginal supply of different agricultural products (Jensen & Andersen 2003), and exhaustive uncertainty assessment (Weidema 2011).
Examples of companies that put particular emphasis on open and transparent reporting of the assumptions and data used are Novozymes (see Weidema & Wesnæs 2005, Wesnæs & Weidema 2006) and Arla Foods (Dalgaard et al. 2016). Examples of very structured and well-documented applications of the consequential procedures are Schmid t (2015) for the identification of the determining output of five oil crops and Schmidt et al. (2011) for country-specific consequential electricity mixes. Sharing well-documented consequential data has become easier with the recent availability of the community website consequential-lca.org.
References
Consequential-LCA (2015). The ISO 14040 standards for consequential LCA. http://consequential-lca.org/clca/why-and-when/the-iso-14040-standards-for-consequential-lca/
Dalgaard R, Schmidt J H, Flysjö A (2014). Generic model for calculating carbon footprint of milk using four different LCA modelling approaches. Journal of Cleaner Production 73:146‑153 https://lca-net.com/p/580
Dalgaard R, Schmidt J H, Cenian K (2016). Life cycle assessment of milk ‐ National baselines for Germany, Denmark, Sweden and United Kingdom 1990 and 2012. Arla Foods, Aarhus, Denmark https://lca-net.com/p/2324
Heintz B, Baisnée P-F. (1992). System boundaries. Pp 35-52 in SETAC-Europe: Life-cycle assessment. Brussels: SETAC. (Report from a workshop in Leiden, 1991.12.02-03).
IISI (1997). Methodology report [of the IISI LCI study]. Brussels: International Iron and Steel Institute.
Jensen JD and Andersen M (2003). Marginale producenter af udvalgte landbrugsprodukter. FØI Working paper no. 08/2003 (in Danish). https://curis.ku.dk/ws/files/135447941/8.pdf.pdf
Nielsen A M, Weidema B P (2001). Input/Output-analysis – Shortcut to life cycle data? Proceedings of a workshop held in Copenhagen on the 29th of September 2000. Copenhagen: Danish Environmental Protection Agency. (Environmental Project 581) https://lca-net.com/p/1125
Reinhard J, Weidema B P, Schmidt J H. (2010). Identifying the marginal supply of pulp wood. Aalborg: 2.-0 LCA consultants. https://lca-net.com/p/198
Schmidt J H. (2015). Life cycle assessment of five vegetable oils. Journal of Cleaner Production 87:130‑138. https://lca-net.com/p/1719
Schmidt J H, Brandão M (2013). LCA screening of biofuels – iLUC, biomass manipulation and soil carbon. This report is an appendix to a report published by the Danish green think tank CONCITO on the climate effects from biofuels: Klimapåvirkningen fra biomasse og andre energikilder, Hovedrapport (in Danish only). CONCITO, Copenhagen. https://lca-net.com/p/227
Schmidt J, Thrane M. (2009). Life cycle assessment of aluminium production in new Alcoa smelter in Greenland. Grønlands Hjemmestyre. https://lca-net.com/p/183
Schmidt J H, Merciai S, Thrane M, Dalgaard R (2011). Inventory of country specific electricity in LCA – Consequential and attributional scenarios. Methodology report v2. 2.‑0 LCA consultants, Aalborg, Denmark. https://lca-net.com/p/212
Schmidt J H, Weidema B P, Brandão M (2015). A framework for modelling indirect land use changes in life cycle assessment. Journal of Cleaner Production 99:230‑238 https://lca-net.com/p/1863
Stone, R. 1961. Input-output and national accounts. Paris: Organization for European Economic Cooperation.
Suh S, Weidema B P, Schmidt J H, Heijungs R. (2010). Generalized Make and Use Framework for Allocation in Life Cycle Assessment. Journal of Industrial Ecology 14(2):335-353. https://lca-net.com/p/200
Thiesen J, Christensen T S, Kristensen T G, Andersen R D, Brunoe B, Gregersen T K, Thrane M, Weidema B P. (2008). Rebound Effects of Price Differences. International Journal of Life Cycle Assessment 13(2):104-114. https://lca-net.com/p/169
Thrane M (2004b): Energy consumption in the Danish fishery – Identification of key factors. Journal of Industrial Ecology 8, 223–239.
Weidema B P. (1993). Market aspects in product life cycle inventory methodology. Journal of Cleaner Production 1(3-4):161-166.
Weidema B P (1999a). A reply to the aluminium industry: Each market has its own marginal. Letter to the Editor responding to previously published article on Marginal production technologies for LCI's. International Journal of Life Cycle Assessment 4(6):309‑310 https://lca-net.com/p/1184
Weidema B P. (1999b). System expansions to handle co-products of renewable materials. Pp. 45-48 in Presentation Summaries of the 7th LCA Case Studies Symposium. Brussels: SETAC-Europe. https://lca-net.com/p/1186
Weidema B P. (2001a). Avoiding co-product allocation in life-cycle assessment. Journal of Industrial Ecology 4(3):11-33. https://lca-net.com/p/1142
Weidema B P. (2001b). Two cases of misleading environmental declarations due to system boundary choices. Presentation for the 9th SETAC Europe LCA Case Studies Symposium, Noordwijkerhout, 2001.11.14-15. https://lca-net.com/p/1131
Weidema B P. (2003a). Market information in life cycle assessment. Copenhagen: Danish Environmental Protection Agency. (Environmental Project no. 863). https://lca-net.com/p/1078
Weidema B P. (2003b). Flexibility for application. Market modelling in LCI databases. Presentation for International Workshop on LCI-Quality, Karlsruhe, 2003.10.20-21. https://lca-net.com/p/1082
Weidema B P. (2008). Rebound effects of sustainable production. Presentation to the "Sustainable Consumption and Production" session of the conference "Bridging the Gap; Responding to Environmental Change - From Words to Deeds", Portorož, Slovenia, 2008.05.14-16. https://lca-net.com/p/175
Weidema B P (2011). Uncertainty reduction in consequential LCA models. Presentation for the Life Cycle Assessment XI (LCA XI) Conference, Chicago, 2011.10.4‑6. https://lca-net.com/p/208
Weidema B P (2013). Reducing impacts of forestry – the fallacy of low-intensity management. Presentation for 6th International Conference on Life Cycle Management, Gothenburg 2013.08.25‑28. https://lca-net.com/p/229
Weidema B P, Norris G A. (2004). Avoiding co-product allocation in the metals sector. Pp. 81-87 in A Dubreuil: "Life Cycle Assessment and Metals: Issues and research directions." Pensacola: SETAC. (Proceedings of the International Workshop on Life Cycle Assessment and Metals, Montreal, Canada, 2002.04.15-17). https://lca-net.com/p/1042
Weidema B P, Wesnæs M (2005). Marginal production routes and co-product allocation for alcoholetoxylate from palm oil and palm kernel oil (zip-file). Study for Novozymes. Copenhagen: 2.‑0 LCA consultants. https://lca-net.com/p/1028
Wesnæs M, Weidema B P (2006). Long-term market reactions to changes in demand for NaOH. Study for Novozymes. Copenhagen: 2.‑0 LCA consultants. https://lca-net.com/p/1014
Weidema B P, Frees N, Nielsen A-M. (1999). Marginal Production Technologies for Life Cycle Inventories. The International Journal of Life Cycle Assessment 4(1):48-56. https://lca-net.com/p/1188
Weidema B P, Wesnæs M, Hermansen J, Kristensen T, Halberg N (2008). Environmental improvement potentials of meat and dairy products. Eder P & Delgado L (eds.) Sevilla: Institute for Prospective Technological Studies. (EUR 23491 EN). https://lca-net.com/p/171
Weidema B P, Bauer C, Hischier R, Mutel C, Nemecek T, Reinhard J, Vadenbo C O, Wernet G (2013). Overview and methodology. Data quality guideline for the ecoinvent database version 3. Ecoinvent Report 1(v3). St. Gallen: The ecoinvent Centre. https://lca-net.com/p/234
With a new report on “LCA screening of biofuels & iLUC, biomass manipulation and soil carbon” 2.-0 LCA consultants have contributed to the ongoing discussions in Denmark on the effects of biomass and other energy sources on climate change.
Our report (in English) is an appendix to a Danish report published by the green think tank CONCITO on the climate effects from bio-fuels: ‘Klimapåvirkningen fra biomasse og andre energikilder, Hovedrapport’. The main report concludes that virtually no energy is completely CO2-neutral and that some biomass sources can have greenhouse gas emissions that are equal to or greater than the emissions from the fossil fuels they replace. This conclusion has spurred a healthy debate about climate effects of bio-fuels in Denmark.
Read the LCA-report: http://concito.dk/files/dokumenter/artikler/biomasse_bilag1_lcascreening.pdf


