

This study compares two production pathways for ammonia with low sulphur fuel oil (VLSFO) used as fuel in shipping. The ammonia is produced through the Haber‐Bosch process, where nitrogen (N2) and hydrogen (H2) are combined into NH3. The main difference between the two ammonia production pathways lies in the H2 production, as the H2 can be from natural gas (CH4) in combination with carbon capture and storage (CCS) or via electrolysis of water (H2O) with renewable electricity sources. Within the industry, the two pathways are often called ‘blue’ and ‘green’ ammonia.
Ammonia must be ignited by a pilot fuel, which is assumed to be VLSFO, and the study therefore compares 1 MJ of ammonia, where VLSFO accounts for 9.6% of the total fuel energy of 1 MJ ammonia, with 1 MJ of VLSFO. Throughout the report, the share of VLSFO as a pilot fuel needed to ignite ammoni a is referred to as ‘ammonia with 9.6% e/e VLSFO’.
The LCA includes all life cycle stages from cradle to grave of ammonia fuel and VLSFO, i.e., production of fuel feedstock, fuel production, distribution and bunkering, as well as storage and combustion on board of the ship. This system boundary is often referred to as ‘well-to-wake’ (WtW).
The report includes two modelling approach: a consequential model and an attributional model aligned with the revised version of the Renewable Energy Directive (RED II) guidelines for renewable fuels of non-biological origin (RFNBOs).
This report is commissioned by A.P. Moller – Maersk and internal quality assurance has been ensured by inviting several relevant stakeholders to take part in the project scoping, data collection, and review of methods and assumptions. While the partners have contributed to validating the technical aspects, they have not participated in the interpretation of the results.
The project partners include: A.P. Moller – Maersk, Environmental Defense Fund Europe, Nippon Yusen Kabushiki Kaisha, CMA CGM, DFDS A/S, American Bureau of Shipping, MAN Energy Solutions, Svitzer A/S and Havenbedrijf Rotterdam N.V.
Appendix 9 – Marginal electricity mixes
Appendix 11 – Final review statement and itemized review report
Download full report here:
Our collaboration with Arla began in 2011 with a carbon footprint of Arla’s milk production in Denmark and Sweden. This work has since expanded and been updated through several iterations into an advanced dairy LCA model. Arla uses this model for baselines and benchmarks of its sustainability goals, as well as a tool for individual farmers to understand where their emissions originate.
Today, the dairy LCA model powers Arla’s FarmAhead™ Check tool, which enables 7,986 farmers across seven European countries to calculate the exact GHG footprint of 1 kg of raw milk from their specific farm.
The tool accounts for over 200 farm inputs, including cow feed, fertiliser use, cattle breeds, manure treatment technologies such as biogas, and energy and fuel consumption. These inputs are combined in the LCA model to produce a farm-specific carbon footprint of the milk.
We continuously update and maintain the LCA model to improve the level of detail in the background data and models, as well as incorporating the best techniques for mitigating GHG emissions in milk production.
This design offers Arla full transparency and data autonomy.
The FarmAhead™ Check tool allows Arla to monitor the progress of its climate strategy and assist farmers in reducing emissions by spotting the most effective reductions.
81% of Arla’s total corporate emissions come from its farmers,[1] and the LCA tool provides unprecedented data transparency into where the emissions originate and how top-performing farmers can lead the way for others to do the same.
By 2022, 99% of Arla’s owner milk volume had been assessed by the FarmAhead™ Check tool. The tool makes it possible for Arla to create a data driven and personalised action plan for each farmer to reduce their climate footprint even further.
Our model includes new GHG mitigation technologies as they become relevant for the farmers, including manure acidification and nitrification inhibitors.
[1] https://www.arla.com/49b894/globalassets/arla-global/sustainability/climate-ambition/arla-climate-ambitions-2030-and-2050-2023.pdf p. 7
Maersk has committed to a new fleet of dual-fuel vessels capable of running on alternative fuels like methanol, but sourcing the amounts of fuel needed to power them is no easy task. To inform their fuel strategy, Maersk needed to track the environmental performance of five different biofuels to compare and benchmark their sustainability.
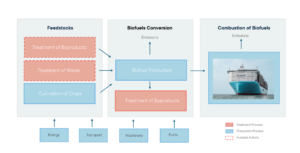
The production of biofuels involves the use of land, feedstocks such as waste, crops or by-products, and large amounts of energy. This means that greenhouse gas (GHG) emissions and environmental impacts can vary significantly between biofuels, depending on what the fuel is made from, how it is processed and treated, and how much land was used in the process.
To achieve the flexible decision support required by Maersk, we delivered an LCA tool modelling the cradle-to-grave impacts of five different biofuels. The tool enables Maersk to consider different production pathways, feedstock inputs and regional markets where the fuel is produced, and to benchmark the GHG and non-GHG impacts from all combinations.
The LCA tool enables Maersk to determine the environmental impacts of any specific biofuel production. Because Maersk’s demand for renewable fuels is so significant, the project also included an estimation of the scalability and availability of each biofuel feedstock. This gives Maersk the market insight needed to choose the most sustainable and economically feasible renewable fuel solution.
Overall, the project gives Maersk unprecedented transparency into the climate risks, land-use change risks, and overall environmental sustainability performance of five biofuel alternatives in real time.
The project included a review of the LCI data currently available in the ecoinvent database for platinum group metals (PGM), a literature review on PGM production by mines worldwide, a market analysis on PGM supply and demand, the identification of the determining product and dependent co-products in each mine, as well as generating LCI datasets for a total of five metals: palladium, platinum, rhodium, iridium and ruthenium, using the ecoinvent database as background.
A baseline climate footprint of the Danmarks Idrætsforbund (DIF) for the year 2019 was calculated through an Organisational Life Cycle Assessment performed by LCA 2.-0 consultants using foreground data from 2019 delivered by DIF in 2022. That part of the project was completed in October 2022. The updated climate footprint for the year 2022 was calculated using foreground data from 2022 delivered by DIF in 2023.
The results of the projects can be used to identify climate impact hotspots and the most relevant options for reducing this impact.
A.P. Moeller Maersk is taking a stand to move the company towards a more ambitious corporate climate commitment. This has led to a top rating by the Climate Corporate Responsibility Monitor in February 2022 for the integrity of the Maersk net zero pledge.
Maersk is one of the biggest players in the global logistics market. We work with Maersk in their quest to reduce the impacts from their hard-to-abate transport business, with the explicit goal of helping Maersk push the entire market toward greener modes of operation.
2.-0 LCA consultants provide science-based support on:
Read more here on Maersk’s own pages on climate change
Recently, our first crowdfunded project on a comparative LCA of RSPO certified and non-certified palm oil was finalized. The study shows that RSPO certified palm oil emits 35% less GHG emissions and is associated with 20% less impacts on biodiversity compared to non-certified palm oil. These results are valid for the average of Indonesia and Malaysia in 2016. However, palm oil producers (certified or not) are not static, and neither are the effect of certification on producers as well as the criteria for being certified. E.g. it is expected that GHG emissions are further reduced in the future as a larger share of especially certified palm oil mills will install biogas capture in the palm oil mill effluent (POME) treatment. Further, new RSPO criteria on no establishment of new oil palm on peat and no deforestation of high conservation value (HCV) land are expected to lead to lower the share of oil palm cultivation on peat and to higher shares of landbank set-aside as nature conservation.
Therefore, it is highly relevant to follow the development over time.
In additional to temporal differences in results, different countries and type of growers (estates and smallholders) will also have an influence on the impact of palm oil production. It is important to trace such differences in order to learn about the potential for improvement options in different producer segments.
Palm oil using companies are currently showcasing their contribution to GHG reductions due to their commitments of buying RSPO certified palm oil. They do this by using the results of our first crowdfunded project on the impact of RSPO certified palm oil for Indonesia and Malaysia in 2016. As the impact of RSPO certified versus non-certified palm oil is not static, it is important to consistently track the developments to make correct claims.
Become a partner of this project and contribute to the development of the next life cycle assessment (LCA) comparing RSPO certified palm oil to non-certified palm oil where results are tracked over time, per country and per type of grower (estates and smallholders).
The features of the project are:
The project was officially launched on 6th November 2019 with a platform presentation at the RSPO RT2019 conference in Bangkok. A scientific paper documenting the outcomes of the study will be submitted to a peer reviewed scientific journal in 2024.
Joining the new crowdfunded project will grant you access to all data and results, and you have access to influence the scope of the project.
The price of subscription is a one-time amount at 3,500 €. The funds from new subscriptions will be used to expand the scope of the project. For additional 2,000 € the results for a specific palm oil mill and its supply-base will be calculated and provided in a small report, including a comparison with the results of the main study.
For subscription (or questions), please contact us. To go to the club click here.
THERBIOR is applicable Europe-wide but is centered on the Mediterranean region. The THERBIOR project aims to provide a solution for the tourism sector, which is characterised by intense seasonal water demand and wastewater discharge.
This project will integrate physical infrastructure such as a highly efficient tubular heat exchanger coupled to a fully off-grid reversible water- source heat pump with a pioneering, novel Sequencing Batch Biofilter Granular Reactor (SBBGR) already installed in the Water Research Institute (CNR-IRSA, Italy), which creates new value through reuse and repurposing.
The main goal is to reuse the heat from the existing novel SBBGR reactor at CNR-IRSA into a low-temperature air conditioning system capable of covering the cooling/heating (CH) and domestic hot water (DHW) demand of an experimental test laboratory; this will be constructed during the project at the CNR-IRSA site. The system will be backed up by short-term storage based on Phase Change Materials (PCM) to ensure year-round coverage of the experimental lab’s CH and DHW demand.
After obtaining satisfactory results from the developed prototype, we will analyse this innovative application’s viability for incorporation into Almeria’s (Spain) and Bari’s (Italy) tourist facility network. Our main goal will be to evaluate how much energy we can gain from a specific urban wastewater network to reduce energy consumption (currently originating mainly from fossil fuels) for cooling/heating purposes in tourist buildings located in the cities.
The project also intends to create new business opportunities, notably by supporting SME involvement in local water and solar-energy supply chains. THERBIOR comprises a consortium of 4 European organisations from Spain, Italy and Denmark, combining a wide range of technical, institutional and business expertise.
Some of the results from the project are published in the Prospective environmental and economic assessment article.
The Nano3Bio project aims to develop biotechnological production systems for nanoformulated chitosans. Chitosans, chitin-derived polysaccharides, vary in: (1) degree of polymerisation (DP); (2) degree of acetylation (DA) and (3) patterns of acetylation (PA).
Chitosans are among the most versatile and most promising biopolymers and have excellent physico-chemical and material properties as well as a wide range of biological functionalities. Their economic potential is far from being exploited due to: (1) problems with reproducibility of biological activities as today’s chitosans are rather poorly defined mixtures and (2) the threat of allergen contamination from their typical animal origin.
The Nano3Bio project will overcome the hurdles towards market entry and market penetration by producing in vitro and in vivo defined polymers with controlled, tailor-made DP, DA and PA.
Applications:
The first life cycle assessment of chitosan production based on data from two real producers located in India and Europe in presented in an article: 'Life cycle assessment of chitosan production in India and Europe'.


