

Detailed and comprehensive accounts of waste generation and treatment form the quantitative basis of designing and assessing policy instruments for a circular economy (CE). We present a harmonized multiregional solid waste account, covering 48 world regions, 11 types of solid waste, and 12 waste treatment processes for the year 2007. The account is part of the physical layer of EXIOBASE v2, a multiregional supply and use table. EXIOBASE v2 was used to build a waste-input-output model of the world economy to quantify the solid waste footprint of national consumption. The global amount of recorded solid waste generated in 2007 was approximately 3.2 Gt (gigatonnes), of which 1 Gt was recycled or reused, 0.7 Gt was incinerated, gasified, composted, or used as aggregates, and 1.5 Gt was landfilled. Patterns of waste generation differ across countries, but a significant potential for closing material cycles exists in both high- and low-income countries. The European Union (EU), for example, needs to increase recycling by approximately 100 megatonnes per year (Mt/yr) and reduce landfilling by approximately 35 Mt/yr by 2030 to meet the targets set by the Action Plan for the Circular Economy. Solid waste footprints are strongly coupled with affluence, with income elasticities of around 1.3 for recycled waste, 2.2 for recovery waste, and 1.5 for landfilled waste, respectively. The EXIOBASE v2 solid waste account is based on statistics of recorded waste flows and therefore likely to underestimate actual waste flows.
Several environmental pressure indicators are based on information that can be obtained from physical supply and use tables (PSUTs). Examples are waste generation indicators, total material requirement (TMR), ecological rucksack, material intensity per product service (MIPS), carbon footprint. Further, when the PSUTs are combined with monetary and energy supply and use tables (MSUTs and EnSUTs), hybrid input-output tables (HIOTs) can be created. With the extensions of the PSUTs, the HIOTS can be used for calculating life cycle environmental pressure indicators for country/regional consumption, products, sectors and trade. The purpose of the current report is to present a generic methodology to create fully mass balanced multi-regional PSUTs.
A key working hypothesis of DESIRE is that an Environmental Extended Multi Regional Input Output database (EE MRIO) is a very powerful way to store environmental, social and economic data for further analysis and indicator construction. The overall objective of work package 5 within DESIRE was to compile such a database assembling multiple data sources into one comprehensive description of the global economy and its environmental impacts. This report covers the development of this database: EXIOBASE 3. The report documents the compilation of the time series of Supply-Use tables (SUT), the data processing of the social and environmental satellite accounts and the assembly of the Multi Regional Supply-Use (MR SUT) and EE MRIO.
EXIOBASE 3 builds upon existing databases, which were developed in previous projects (EXIOBASE 1 - EXIOPOL, fp6: A. Tukker et al. 2013; EXIOBASE 2 - CREEA, fp7: Wood et al. 2014). In EXIOBASE 3, the level of detail in the description of the economy is consistent with the previous version EXIOBASE 2, as is the implementation of the economic and environmental accounting principles proposed in the UN System of Economic and Environmental Accounts (European Commission et al. 2012). The geographic focus of EXIOBASE 3 is kept at the country level of the EU (now including the new member state Croatia), with adequate description of major non-EU economies. That ensures that reasonable estimates of resource efficiencies under consideration of upstream resource use of imports and exports can be provided.
EXIOBASE 3 pushes the state of the art in the field of global EE MRIOs. EXIOBASE exhibits a consistent sector classification of 200 products and 163 industries for all included countries and regions. The historic time series, ranging from 1995 to 2012, provide a description of the global economy consistent with international databases (“United Nations Statistics Division - National Accounts” 2013; FAO Statistics Division 2012; International Energy Agency 2012 etc.). To date, EXIOBASE 3 is the only nowcasted EE MRIO database, with time series running to 2016. Economic parameters of the now-casted years follow the estimates given by the International Monetary Fund (“IMF World Economic Outlook Database List” 2015). Trends in the change of the economic structure of SUT data are extrapolated from observed trends in the historic time series and resource usage is now-casted based on latest available resource efficiency data.
The new version of EXIOBASE provides policy-makers with a unique tool to assess the outcome of policies set in place to reduce environmental impacts and increase resource efficiency. With its high sectorial detail and the wide spectrum of environmental data consistently included in EXIOBASE, the now-casted EXIOBASE provides a very valuable tool for a range of environmental-economic assessments. Most importantly, EXIOBASE can assist in the implementation of the Resource Efficiency Roadmap (European Commission 2011a) both with economy-wide assessments, e.g. to produce aggregated headline indicators, as well as on assessments of the Roadmap’s priority areas, such as energy, food, buildings and mobility. EXIOBASE is also of high importance for assessments in the context of the transformation towards a competitive, low-carbon, economy (European Commission 2011b), as well as specific environmental strategies such as the EU Blueprint to safeguard Europe's Waters (European Commission 2012) or EU’s biodiversity strategy (European Commission 2011c).
Work package 5 (WP5) aims to compile an Environmentally-Extended Multi-Regional Input–Output database (EEMRIO) time series and calculate ‘macro resource indicators’ based on this database. In order to do so, the following tasks have to be accomplished:
This interim report focus on the compilation task 2 and describes the initial data gathering done for task 3. It is based on the previous report D 5.1 (inception report).
This report includes a description of how required data is obtained, refined and applied it to build the first MRIO time series. The report outlines methods to incorporate information about changing product and industry ouput as well as structural changes in the economy.
Following the plans described in D 5.1. a macro economic database was compiled which is used as overall constrain for all further economic modelling. This and data from the previous fp7 project CREEA was used to compile the first time series of monetary supply use tables. The final time series will include trade data and information about structural change within the domestic economies over time. The data compilation and refining process for this task is on track.
EXIOBASE includes various macro resource accounts (“environmental extensions” or “satellite accounts”). At the end of this workpackage, all these data will be gathered from the different groups and save in the EXIOBASE database. Multiple testing routines were developed to ensure consistency among the different datasets.
Time lags of several year hinders the use of MRIOs for policy making. DESIRE will explore options for now-casting the EEIO database and indicator results. We investigated several possibilities and data sources to do so and report on the outcome of this process.
In addition to monetary tables, physical IO time series data will be calculated. The procedure will be slightly different from that already developed for the EXIOBASE 2/CREEA since time series allows a better modelling of the production of waste from accumulated materials.
Several datasets have been compiled during the last month of the project. These have been distributed among all working group partners through the data sharing facility provided by TNO (sharepoint).
In this final report of the DESIRE project we convert results from all previous work packages into conclusions, and present results of prioritized indicators that could be calculated with readily available statistical data, and present an indicator implementation roadmap. Conclusions on the most appropriate Resource Efficiency indicator framework are based on:
This report also builds on a preliminary draft version that was distributed in the form of a discussion note among participants of the final conference on the 21st of January 2016 in Brussels. Discussions during the conference functioned as last stakeholder consultation round of which the outcomes are taken aboard in the indicator implementation roadmap as presented in the current report.
The aim of this article is to present a new model and tool to calculate life cycle inventories (LCIs) of chemicals discharged down the drain. Exchanges with the technosphere and the environment are attributed for based on the predicted behaviour of individual chemicals in the wastewater treatment plant (WWTP) and following discharge to the aquatic environment, either through the treated effluent or directly when there is no connection to WWTP. The described model is programmed in a stand-alone spreadsheet, WW LCI.
The model includes treatment in a modern WWTP and sludge disposal as well as the greenhouse gas (GHG) and nutrient emissions from degradation in the environment. The model fundamentals are described, and its application is shown with six industrial chemicals: sodium carbonate, ethanol, tetraacetylethylenediamine (TAED), diethylenetriamine penta(methylene phosphonic acid) (DTPMP), zeolite A and sodium tripolyphosphate (STPP). This application considers two scenarios: Germany, with full connection to WWTP, and a generic direct discharge scenario. The scenario with WWTP connection is assessed with WW LCI as well as with the wastewater treatment model developed for ecoinvent. Results are presented for key LCI flows and for life cycle impact assessment (LCIA), focusing on GHG emissions, freshwater ecotoxicity and marine and freshwater eutrophication.
GHG emissions predicted by WW LCI differ to those predicted by the ecoinvent model, with the exception of sodium carbonate. For zeolite A and DTPMP, WW LCI predicts GHG emissions 330 higher and 12.5 times lower, respectively. Eutrophication scores are lower for WW LCI as the German scenario considers more optimistic nutrient removal rates than the default ones from the ecoinvent model. Freshwater ecotoxicity is mainly driven by the magnitude of the USEtox characterization factors; however, the ecoinvent model cannot accommodate chemical-specific toxicity assessments. When WW LCI is used to compare a direct discharge scenario with the German scenario, differences are found in all three impact categories.
WW LCI provides a comprehensive and chemical-specific inventory, constituting an advance over previous models using generic descriptors such as biological oxygen demand. This level of detail comes at the price of an increased effort for collecting input data as well as the need to identify individual chemicals in wastewater prior to the assessment. The LCIs generated through this model can then be applied in the context of LCA studies where each chemical contributes to the total life cycle impacts of a product or service.
ShareIt link: http://rdcu.be/ke7W
Purpose
Good background data are an important requirement in LCA. Practitioners generally make use of LCI databases for such data, and the ecoinvent database is the largest transparent unit-process LCI database worldwide. Since its first release in 2003, it has been continuously updated, and version 3 was published in 2013. The release of version 3 introduced several significant methodological and technological improvements, besides a large number of new and updated datasets. The aim was to expand the content of the database, set the foundation for a truly global database, support regionalized LCIA, offer multiple system models, allow for easier integration of data from different regions, and reduce maintenance efforts. This article describes the methodological developments.
Methods
Modeling choices and raw data were separated in version 3, which enables the application of different sets of modeling choices, or system models, to the same raw data with little effort. This includes one system model for Consequential LCA. Flow properties were added to all ex- changes in the database, giving more information on the inventory and allowing a fast calculation of mass and other balances. With version 3.1, the database is generally waterbalanced, and water use and consumption can be determined. Consumption mixes called market datasets were consistently added to the database, and global background data was added, often as an extrapolation from regional data.
Results and discussion
In combination with hundreds of new unit processes from regions outside Europe, these changes lead to an improved modeling of global supply chains, and a more realistic distribution of impacts in regionalized LCIA. The new mixes also facilitate further regionalization due to the availability of background data for all regions.
Conclusions
With version 3, the ecoinvent database substantially expands the goals and scopes of LCA studies it can support. The new system models allow new, different studies to be performed. Global supply chains and market datasets significantly increase the relevance of the database outside of Europe, and regionalized LCA is supported by the data. Datasets are more transparent, include more information, and support, e.g., water balances. The developments also support easier collaboration with other database initiatives, as demonstrated by a first successful collaboration with a data project in Québec. Version 3 has set the foundation for expanding ecoinvent from a mostly regional into a truly global database and offers many new insights beyond the thousands of new and updated datasets it also introduced.
The publication is a shorter version of the data-quality guideline.
ShareIt: http://rdcu.be/mT3g
Life Cycle Assessment (LCA) is the study of the environmental impact of products taking into account their entire life-span and production chain. This requires gathering data from a variety of heterogeneous sources into a Life Cycle Inventory (LCI). LCI preparation involves the integration of observations and engineering models with reference data and literature results from around the world, from different domains, and at varying levels of granularity. Existing LCA data formats only address syntactic interoperability, thereby often ignoring semantics. This leads to inefficiencies in information collection and management and thus a variety of challenges, e.g., difficulties in reproducing assessments published in the literature. In this work, we present an ontology pattern that specifies key aspects of LCA/LCI data models, i.e., the notions of flows, activities, agents, and products, as well as their properties.
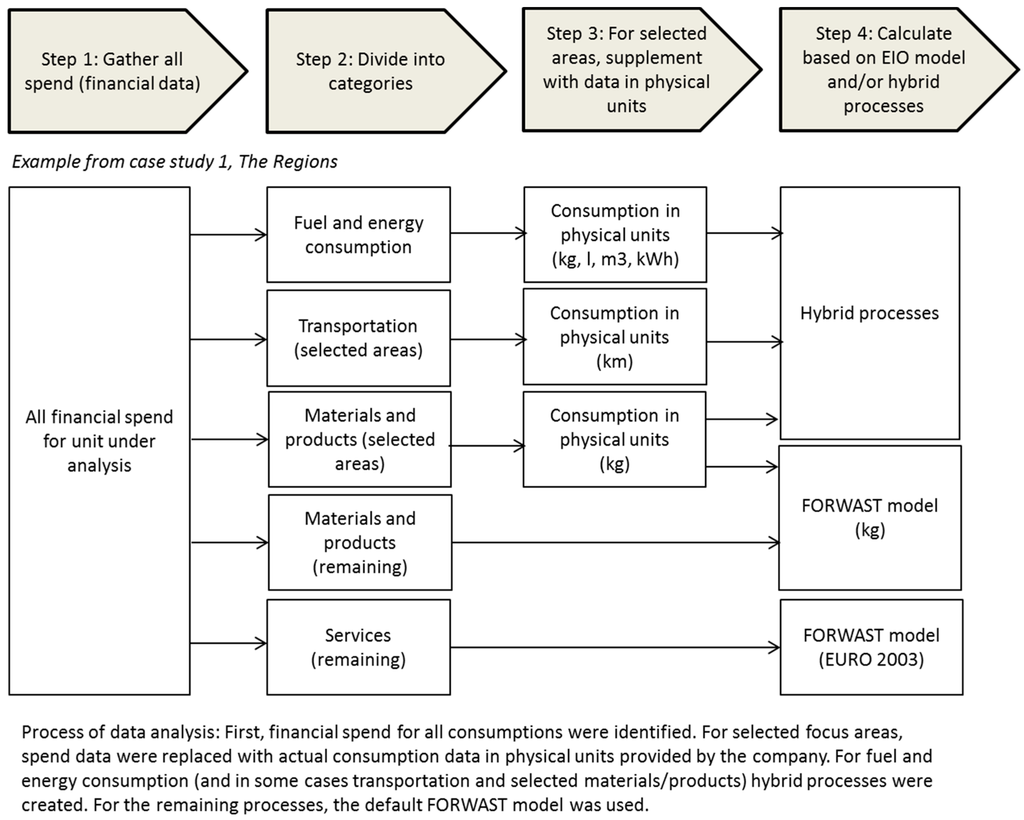
An increasing number of companies are expanding their environmental impact reduction targets and strategies to include their supply chains or whole product life cycles. In this paper, we demonstrate and evaluate an approach, where we used a hybrid Environmental Input-Output (EIO) database as a basis for corporate and product environmental footprint accounts, including the entire supply chain. We present three cases, where this approach was applied. Case study 1 describes the creation of total corporate carbon footprint accounts for three Danish regional healthcare organisations. In case study 2, the approach was used as basis for an Environmental Profit and Loss account for the healthcare company, Novo Nordisk A/S. Case study 3 used the approach for life cycle assessment of a tanker ship. We conclude that EIO-based analyses offer a holistic view of environmental performance, provide a foundation for decision-making within reasonable time and cost, and for companies with a large upstream environmental footprint, the analysis supports advancing their sustainability agenda to include supply chain impacts. However, there are implications when going from screening to implementing the results, including how to measure and monitor the effect of the different actions. Thus, future research should include more detailed models to support decision-making.
Research projects aiming to develop new technologies, products, and services increasingly use life cycle assessment (LCA) as a means of providing information about the potential for sustainability of the technology under development. While using LCA at this early stage clearly provides benefits in terms of steering decisions towards sustainable choices, this collides with the practicalities of LCA, which is a sophisticated and data-demanding method. In this work we give an overview of the main challenges that the LCA practitioner encounters in such prospective assessments and how they can be overcome, with the example of a case study on biotreatment of water resources.


