

We conducted a top-level assessment of greenhouse-gas (GHG) emissions, water, and land use associated to production of the following protein sources:
This was achieved by means of a review of LCA literature, complemented with modelling done specifically for this study.
Recently, our first crowdfunded project on a comparative LCA of RSPO certified and non-certified palm oil was finalized. The study shows that RSPO certified palm oil emits 35% less GHG emissions and is associated with 20% less impacts on biodiversity compared to non-certified palm oil. These results are valid for the average of Indonesia and Malaysia in 2016. However, palm oil producers (certified or not) are not static, and neither are the effect of certification on producers as well as the criteria for being certified. E.g. it is expected that GHG emissions are further reduced in the future as a larger share of especially certified palm oil mills will install biogas capture in the palm oil mill effluent (POME) treatment. Further, new RSPO criteria on no establishment of new oil palm on peat and no deforestation of high conservation value (HCV) land are expected to lead to lower the share of oil palm cultivation on peat and to higher shares of landbank set-aside as nature conservation.
Therefore, it is highly relevant to follow the development over time.
In additional to temporal differences in results, different countries and type of growers (estates and smallholders) will also have an influence on the impact of palm oil production. It is important to trace such differences in order to learn about the potential for improvement options in different producer segments.
Palm oil using companies are currently showcasing their contribution to GHG reductions due to their commitments of buying RSPO certified palm oil. They do this by using the results of our first crowdfunded project on the impact of RSPO certified palm oil for Indonesia and Malaysia in 2016. As the impact of RSPO certified versus non-certified palm oil is not static, it is important to consistently track the developments to make correct claims.
Become a partner of this project and contribute to the development of the next life cycle assessment (LCA) comparing RSPO certified palm oil to non-certified palm oil where results are tracked over time, per country and per type of grower (estates and smallholders).
The features of the project are:
The project was officially launched on 6th November 2019 with a platform presentation at the RSPO RT2019 conference in Bangkok. A scientific paper documenting the outcomes of the study will be submitted to a peer reviewed scientific journal in 2024.
Joining the new crowdfunded project will grant you access to all data and results, and you have access to influence the scope of the project.
The price of subscription is a one-time amount at 3,500 €. The funds from new subscriptions will be used to expand the scope of the project. For additional 2,000 € the results for a specific palm oil mill and its supply-base will be calculated and provided in a small report, including a comparison with the results of the main study.
For subscription (or questions), please contact us. To go to the club click here.
Slides below, the extended abstract here.
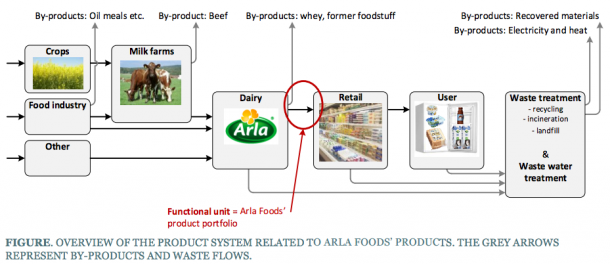
To document the total life cycle environmental impact of their product portfolio, Arla Foods is conducting an Environmental Profit and Loss Account (E P&L). The E P&L expresses Arla Foods’ environmental impacts in monetary units, in addition to the underlying physical units. Arla Foods intends to use the results to evaluate their environmental strategy 2020 in order to assure that its focus is put on priority areas. Furthermore, the findings are intended to be used in various communications and it is an important step towards showing that Arla takes its environmental commitment seriously and takes responsibility for the whole value chain. The unit of analysis is the sum of all Arla’s activities in 2014. Hence, the E P&L includes all environmental life cycle impacts from cradle to grave of the sum of all Arla’s products for the financial year 2014. The included product system is illustrated in the figure below.
Systembolaget in Sweden, Alko in Finland, and Vinmonopolet in Norway have social responsibility policies that include the environmental impact related to their activities. As part of this, the monopolies seek to identify the most important of their environmental impacts and options for reducing them. This study pertains to the product turnover in year 2014 and has been published in a report: Environmental impacts of alcoholic beverages.
For this project we work together with the clients own in-house expertise. The project focus on the carbon footprint and includes induced (cradle-to-gate) impacts in the client’s own products, as well as avoided impacts in their customer’s value chain. Most of the results are presented in proprietary reports, but some of our results have been presented to the LCA community at the LCAFood 2014 conference: Specialty Food Ingredients - Environmental Impacts and Opportunities.
The Danish apparel sector is globally recognised and economically important to the Nordic region. The textile sector for Denmark had an estimated value of DKK 38.6bn in 2012 (DMOGT, 2013), including apparel and other textiles. Like most apparel, it is associated with environmental impacts across supply chains worldwide. The Danish Environmental Protection Agency commissioned Niras, 2.-0 LCA consultants and Trucost to conduct a triple-level natural capital valuation to determine the impacts of apparel production , where they occur and what the significant impacts are in monetary terms. The analysis focuses on three levels of the apparel sector in Denmark. These are:
This helps stakeholders to understand the natural capital dependencies throughout differing levels of the apparel sector supply chain, allowing better development of sourcing policies and interventions for improvements.
Natural capital accounting in the apparel sector is receiving increased interest, with the 2014 Global Leadership Award in Sustainable Apparel (GLASA) focussing on natural capital advancement in the sector (SFA, 2014). The relevance of natural capital accounting for apparel companies is being driven by factors such as water scarcity, which is threatening crop production as demonstrated by cotton slumps and price hikes following droughts in China and the US, and reputational risk, as witnessed by campaigns over factory working conditions and hazardous chemicals. The study captures greenhouse gas (GHG) emissions, air and water pollution and water consumption, as well as the impact of indirect land use change (ILUC). The study does not capture the direct land use change or other environmental aspects.
Over 80% of Danish apparel is imported as finished product, and most of the environmental impacts are associated with activity outside of the country. The figure shows the distribution of impacts across the three key import countries (Turkey, China and India) for finished apparel, along with impacts associated with the rest of the world (RoW).
As such, influencing reduction of impacts is more difficult to control, and opportunity exists through supplier engagement and sustainable procurement policies, as well as through consumption measures. Further to this, by using the sector level natural capital account, companies operating in the industry may be able to better understand where to focus their engagement and target improvement.
The results of the sector level natural capital account show that the most material impacts are associated with raw material production in Tier 5, and the final stages of tailoring apparel, Tier 1 (though this phase includes the whole supply chains of accessories and adornments/trims), and Tier 2. Impacts are dominated by GHG emissions, air pollution and water, though water is significantly more material within Tier 5 than other tiers, due to irrigation and farming requirements. Should the sector have to internalise natural capital costs of indirect land use change, water consumption, air and water pollution and GHG emissions, a total cost of DKK 3,390 m would be apparent, equivalent to 11.7% of total revenue for the sector. When considering average profit for the sector in 2012 was less than 6% of revenue (Deloitte, 2014), if the natural capital cost remained constant, this risk would equate to almost twice the profit margin of the year, resulting in a net loss for the sector.
Specialty food ingredients (SFIs or just ‘specialty ingredients’) such as emulsifiers, food enzymes, hydrocolloids and cultures are typically applied in small amounts (<1% w/w of the final food product). Generally, little attention has been given to specialty ingredients in the LCA community (Foster et al 2006, BCFN 2011). DuPont Nutrition & Health (N&H) is a leading producer of specialty food ingredients worldwide. During the last five years, DuPont N&H has completed cradle-to-gate LCAs of a wide range of specialty ingredients, based on both attributional and consequential modeling. The average carbon footprint of DuPont N&H products is 3-4 kg CO2e per kg (cradle-to-gate) but they only represent a small share of the final consumer products carbon footprint. More importantly, most solutions enable significant reductions of our customer’s footprint by enabling replacement of animal derived raw materials (with e.g. soy protein), in-creasing processing efficiency or enabling reduced food waste in retail and households. DuPont N&H has identified more than 70 ‘sustainable solutions’ and LCA screenings of 40 cases show that they can help customers reducing between 10 and 100 kg CO2e per kg specialty ingredient applied.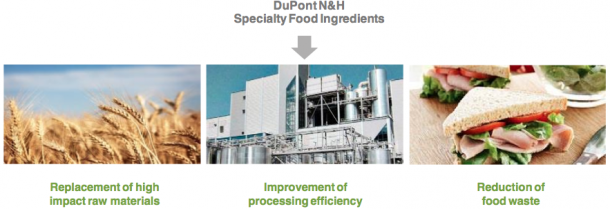 Figure 1. Conceptual model of interaction between SFIs (top center) and the food value chain with raw material providers (left), food producers (center) and finally end-consumers (right).


