

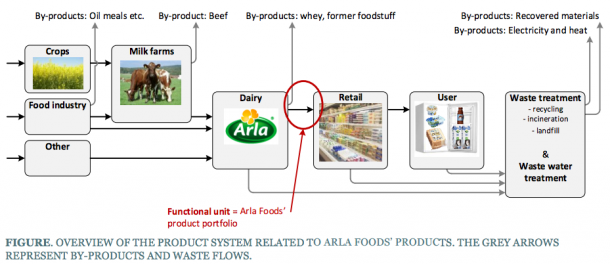
To document the total life cycle environmental impact of their product portfolio, Arla Foods is conducting an Environmental Profit and Loss Account (E P&L). The E P&L expresses Arla Foods’ environmental impacts in monetary units, in addition to the underlying physical units. Arla Foods intends to use the results to evaluate their environmental strategy 2020 in order to assure that its focus is put on priority areas. Furthermore, the findings are intended to be used in various communications and it is an important step towards showing that Arla takes its environmental commitment seriously and takes responsibility for the whole value chain. The unit of analysis is the sum of all Arla’s activities in 2014. Hence, the E P&L includes all environmental life cycle impacts from cradle to grave of the sum of all Arla’s products for the financial year 2014. The included product system is illustrated in the figure below.
This report presents the results of the Carbon Foot-printing (CF) of milk production in the United Kingdom and in Germany in 1990.
Milk production is often related to large area of grassland. For this reason the United Kingdom and Germany are among the most important milk producers’ countries in the European Union, together with Holland, Denmark, Belgium and some regions of France and Italy. In particular, Northern Ireland, Scotland and the South West of England are the regions in the United Kingdom with the highest milk production. Similarly, in Germany the milk production is concentrated in the grassland rich northern region of Schleswig-Holstein, in the North West part of Lower Saxony, in the central Thuringia and in the South Eastern Bavaria (Eurostat 2013).
The most common dairy cow in Britain is the black and white Holstein-Friesian breed that represents 90% of the British herd. Other breeds that can be seen are the Ayrshire, Jersey and Guernsey (DairyCo 2013). More than 80% of dairy cows in Germany belong to the major breeds German Holstein (both black and white and red and white), the German Fleckvieh (Simmental) and the German Braunvieh (Brown Swiss). The diversity of the cattle breeds depends on regional climate differences and fodder availability. In the North and East German Holstein are the most common breeds. In the south Simmental and Brown Swiss Cattle are dominant (German Livestock 2013).
The study focuses mostly on 1990 national data when these are available, or on national data collected in the following years when data from 1990 are not available. In case data are not available, figures relative to the CF of milk production in 1990 in Denmark are used (Dalgaard and Schmidt 2012a). In particular, the following changes are applied to Dalgaard and Schmidt (2012a):
- Milk yields and feed intake.
- Electricity mix in the United Kingdom.
- Crop yields, straw removal, type and amount of fertiliser applied to feed crops (Section 4.1).
- Prices (Appendix C).
The most important animal-related factors when analyzing the milk system are the lactation, amount of feed intake, the live weight and milk yield. Among these factors there are partial interactions. Therefore most of the effects are related to each other.
The milk yield in the United Kingdom in 1990 was 15,251 t of raw milk and 31,307 t in Germany (FAOSTAT 2013). The average live weight of animals was 572 kg and 608 kg respectively in the UK and Germany. Data concerning the composition of feed are also important. However information concerning composition of ration is not always available for 1990 or difficult to find.
Despite a mature debate on the importance of a time-dependent account of carbon fluxes in life cycle assessments (LCA) of forestry products, static accounts of fluxes are still common. Time-explicit inventory of carbon fluxes is not available to LCA practitioners, since the most commonly used life cycle inventory (LCI) databases use a static approach. Existing forest models are typically applied to specific study fields for which the detailed input parameters required are available. This paper presents a simplified parametric model to obtain a time-explicit balanced account of the carbon fluxes in a forest for use in LCA. The model was applied to the case of spruce as an example.
The model calculated endogenous and exogenous carbon fluxes in tons of carbon per hectare. It was designed to allow users to choose (a) the carbon pools to be included in the analysis (aboveground and belowground carbon pools, only aboveground carbon or only carbon in stem); (b) a linear or sigmoidal dynamic function describing biomass growth; (c) a sigmoidal, negative exponential or linear dynamic function describing independently the decomposition of aboveground and belowground biomass; and (d) the forest management features such as stand type, rotation time, thinning frequency and intensity.
The parametric model provides a time-dependent LCI of forest carbon fluxes per unit of product, taking into account the typically limited data available to LCA practitioners, while providing consistent and robust outcomes. The results obtained for the case study were validated with the more complex CO2FIX. The model ensures carbon balance within spatial and time delimitation defined by the user by accounting for the annual biomass degradation and production in each carbon pool. The inventory can be used in LCA studies and coupled with classic indicators (e.g. global warming potential) to accurately determine the climate impacts over time. The model is applicable globally and to any forest management practice.
This paper proposes a simplified and flexible forest model, which facilitates the implementation in LCA of time-dependent assessments of bio-based products.
ShareIt link: http://rdcu.be/nspw
The primary aim of this report is to present data for the environmental profile of pork and to identify the most polluting parts in the product chain of Danish pork by use of the Life Cycle Assessment (LCA) methodology. The functional unit was ‘1 kg of Danish pork (carcass weight) delivered at the Port of Harwich’, and the environmental impact categories considered were global warming, eutrophication, acidification and photochemical smog. The global warming potential was 3.6 kg CO2 equivalents per functional unit, which corresponds to the emissions from a 10 km drive in a typical passenger car.
It was found, that the environmental ‘hot spots’ in the production chain of Danish pork occur in the stages before the pigs’ arrival at the slaughterhouse. The highest contributions to global warming, eutrophication and acidification arise from production of feed and handling of manure in the pig housing and under storage. However, the manure/slurry applied to the fields also made a significant contribution to eutrophication potential. The transport of the pork to the Port of Harwich was not an environmental hot spot and contributed less than 1% of the total amount of greenhouse gasses emitted during the production. This result highlights, that ‘Food miles’ are a misleading environmental indicator.
The environmental profile of pork established was based on data from 2005, and it was found, that the environmental impact (global warming, eutrophication and acidification potentials) has been reduced since 1995. These environmental improvements were mainly obtained by lower feed (and protein) consumption and improved handling of manure/slurry. A potential exist for improving the environmental profile further. In particular, the greenhouse gas emission per kg pork can be reduced, if the manure/slurry is anaerobically digested, and the biogas is used for heat and power production.
The environmental impact of Danish pork was compared with the environmental impact of British and Dutch pork. This comparison showed, that the global warming potentials were equal, whereas the eutrophication and acidification potential was highest for British pork. Dutch pork had slightly lower eutrophication and acidification potential compared to that of Danish pork.
In agriculture and forestry, an important means for mitigating impacts on biodiversity and climate change is nature conservation. However, this is seldom included in life cycle assessment (LCA) and most LCA and footprint guidelines prescribe that such off-setting shall be excluded from the system (e.g. ISO 14067; PEF guideline; ILCD guideline; PAS2050; the GHG protocol). Obviously, there are good reasons for excluding off-setting in the guidelines, however in some cases the distance between the studied product system and a mitigation option (offset) is very short, and the industry managing the product system may be the (only) one who is able to conserve high value biodiversity and carbon stock areas. This is the case of companies operating in countries where the frontier between product systems and high conservation value nature is moving.
The purpose of this paper is to describe how the most recent research within indirect land use changes (iLUC) can be used to creating a cause-effect based method for quantifying the life cycle implications of nature conservation. The application of the method is demonstrated with a case study LCA of palm oil production at United Plantations Berhad in Malaysia and Indonesia. With their recent expansion of the plantation area into Central Kalimantan Indonesia, United Plantations has voluntarily set-aside more than 8000 ha of high value conservation and high carbon stock land for permanent nature conservation. The findings are used to recommend how LCA and footprint guidelines should be revised in order to enable for the inclusion of important mitigation options.
Measuring progress towards sustainable development requires appropriate frameworks and databases. The System of Environmental-Economic Accounts (SEEA) is undergoing continuous refinement with these objectives in mind. In SEEA, there is a need for databases to encompass the global dimension of societal metabolism. In this paper, we focus on the latest effort to construct a global multi-regional input−output database (EXIOBASE) with a focus on environmentally relevant activities. The database and its broader analytical framework allows for the as yet most detailed insight into the production-related impacts and “footprints” of our consumption. We explore the methods used to arrive at the database, and some key relationships extracted from the database.


