

The comprehensive global multi-regional input-output database EXIOBASE database is ideal for corporate, sectoral, national and global footprinting. Furthermore, the database can be used as a background database for detailed LCAs as well as for mass flow analysis of regions and countries as part of circular economy analyses. Other uses include life cycle costing, social LCA etc.
Currently, EXIOBASE 3 has a fully-fledged version in hybrid units with accounting for most commodities in physical units and fully mass-balanced accounts that also provide estimates on waste generation and treatments/recycling. The current hybrid version of EXIOBASE uses 2011 as base year and therefore, there is a need for updating to a more recent year. Through the EXIOBASE Hybrid Update Club, this project will provide such an update.
This project is initiated by 2.-0 LCA Consultants, who led the development of the hybrid work in EXIOBASE as a member of the EXIOBASE consortium. At the moment, the hybrid update project does not involve other consortium members but builds upon the work of others in the consortium. As such, the update project will stand on the shoulders of hundreds of person-months delivered by the EXIOBASE partners. The current publicly available version of EXIOBASE (version 3) is an outcome of several projects funded under EU’s 6th and 7th Framework programmes:
All the material developed as part of this crowdfunded project will be made available to the public, and published on Zenondo here: https://zenodo.org/records/13449634
Currently, the following materials have been published:
EXIOBASE v3 is licensed under a Creative Commons Attribution-ShareAlike 4.0 International License.
As a member of the crowdfunded project, you will contribute to the development of EXIOBASE-hybrid update.
If you want to learn more about the current EXIOBASE 3 and the hybrid version, you can access this free one-hour webinar recorded on 18th September 2019.
Below, we have listed a number of selected publications:
NTNU: Currently, there is a monetary version of EXIOBASE for the years 1995-2022 published by NTNU (see https://zenodo.org/records/5589597 for more info). The time-series referred to in the above publications are based on nowcasted data from 2011. The monetary version has a range of environmental extensions provided by partners, including Vienna University (material accounts to 2013), University of Natural Resources and Life Sciences, Vienna (land use to 2015), and Arkaitz Usubiaga of UCL (energy and fuel combustion emissions to 2015) and estimated updates of all greenhouse gas emission data to 2018-2019 (NTNU). The monetary tables are a fundamental prerequisite for updating of the hybrid version of EXIOBASE. Therefore, thanks to NTNU, this work will feed into the current update project, where we produce an update of the hybrid version of EXIOBASE. For further information and updates of the monetary tables, please contact Richard Wood, wood@ntnu.no.
For club membership (or questions), please contact us. To go to the club click here.
Due to increased policy attention on circular economy strategies, many studies have quantified material use and recovery at national and global scales. However, there has been no quantitative analysis of the unrecovered waste that can be potentially reintegrated into the economy as materials or products. This can be interpreted as the gap of material circularity. In this paper we define the circularity gap of a country as the generated waste, plus old materials removed from stocks and durable products disposed (i.e. stock depletion), minus recovered waste. We estimated the circularity gap of 43 nations and 5 rest of the world regions in 2011, using the global, multiregional hybrid-units input-output database EXIOBASE v3.3. Our results show the trends of circularity gap in accordance to each region. For example, the circularity gaps of Europe and North America were between 1.6–2.2 tonnes per capita (t/cap), which are more than twice the global average gap (0.8 t/cap). Although these regions presented the major amount of material recovery, their circularity gaps were mostly related to the levels of stock depletion. In Africa and Asia-Pacific regions, the circularity gap was characterized by a low degree of recovery and stock depletion, with high levels of generated waste. Moreover, we discuss which intervention types can be implemented to minimize the circularity gap of nations.
The production perspective of the inventory includes an overview of the total material and energy inputs for all companies (both private and public) in Kolding Municipality, as well as their entire product and production waste output. For all companies the total environmental impacts of all purchases (materials, energy, services etc.), direct emissions, as well as treatment of corporate waste will be calculated. Environmental impacts will be shown as greenhouse gas emissions as well as a selection of other environmental impact categories, such as particle pollution, biodiversity, industrial salt load etc. The impact categories have been selected in collaboration with Kolding Municipality.
The consumption perspective of the inventory includes a statement of the total material and energy inputs to and waste output from Kolding Municipality's citizens. In addition, the same environmental impacts as for the companies are calculated for citizens' total consumption of goods, energy, services, public services and waste treatment services.
Short project description: Kort projekt beskrivelse på dansk
Final report (in Danish): Cirkulær økonomi i Kolding Kommune
Interest from the research and policy community in the circular economy (CE) is growing. This research describes how the potential for a circular economy in open economies can be estimated by using different assessment methods. Methods and indicators have been selected that have a relevance for one or more of the public policy objectives for circular economy: Openness Index, economic structure, Balassa Index, value chain analysis, substitution potential of Sustainable Materials Management (SMM) strategies, waste treatment scenarios based on physical and hybrid Input-Output (IO) analysis. These methods differ in scope and degrees of complexity and are used at different assessment levels. The potential for a circular economy in this paper is assessed by evaluating the contribution to the public policy objectives for CE: resource efficiency, reduction of dependency on materials, competitiveness, creation of domestic jobs, reduced Greenhouse Gas (GHG) emissions. Results obtained by these methods are shown for Belgium and, in some cases, compared to the results of other countries to illustrate the differences between economies. CE activities (in response to public policy objectives) will enhance the ongoing trend of reducing the share of primary sectors in economies. The openness of an economy is expressed as the ratio of sum of import and export and Gross Domestic Product (GDP). Imported products add to the potential of domestic closed-loop circular initiatives like re-use, repair, remanufacture, recycling, but this will require knowledge about composition and spare part availability. Exported products are no longer available for these domestic CE initiatives, reducing the domestic potential for CE and the domestic export activity is vulnerable to CE activities abroad. Especially the increasing geographical distance in trade complicates the practical and legal barriers to close the loop. In open economies, both global and domestic substitution effects due to new circular economy policy initiatives are important to consider.
Sustainable Consumption and Production is one of the leading principle towards reducing environmental impacts globally. This study aims at combining Environmentally-Extended Input-Output Analysis (using EXIOBASE 3) with up-to-date impact assessment models to quantify the environmental impacts induced by final consumption in the EU Member States in 2011. The environmental extensions are characterized in 14 environmental impact categories out of the 16 used in the Environmental Footprint life cycle impact assessment method. A contribution analysis of key products and services as well as emissions and resources, which drive the environmental impacts of EU consumption, is conducted. Environmental impacts are mainly induced along the supply-chain of products and services. Several expenditures relative to services represent large shares both in the total final consumption and in the 14 impacts under study, despite a relatively low impact intensity. Food products, in particular meat and dairy products, are identified as key contributors regarding acidification, eutrophication, land use, and water use, and to a lower extent climate change. Finally, several manufactured products, raw materials and basic products respectively importantly contribute to impacts on human toxicity, freshwater ecotoxicity and resource uses. The total volume of final consumption expenditures per EU Member State appears a key explanatory variable to most of the impacts embodied in their consumption, yet to a lower extent regarding water use and fossils resource use. Finally, the current limitations in using EXIOBASE 3 for environmental impact assessment are discussed, with specific attention to EXIOBASE environmental extensions and to the case study on EU consumption. Since the classification of emissions and resources for impact assessment requires a number of assumptions that may influence the results, a sensitivity analysis is performed to exemplify some of the key issues relative to the characterization of impacts based on EXIOBASE environmental extensions.
WP4 developed within FORWAST project intended to provide comprehensive and validated data on material flows for different economy sectors of the life cycle of resources to waste, in a perspective of broad coverage of the EU territory. The objectives of WP-4 were therefore to: Provide data related to resources and products flows for all the sectors of economy for the 23 member states, identifying specific of the each country or country group, Compile and validate data from different sources as well as to achieve the consistency of the obtained datasets, Identify needs for development of national statistics related to resources and wastes.
The objective of this report D4-1 is to document data collection, processing and validation for each of the EU-23 countries. The chapters from 1 to 23 provide a detailed overview of data mining and methodology used for creation of SUTs MASTERs for each of the EU-23 countries.
......
Each of the following chapters discussed the country-specific data mining and processing along the mentioned below aspects:
• Presentation of data availability and data processing,
• Identification of gaps and filling them by estimations,
• Construction of SUTs MASTER matrices,
• Validation process and adjustment to reach consistency of data.
Chapter 24 contains summary of conclusions from data mining and processing as well as construction of SUTs MASTERs for the EU-23 countries.
The COP21 summit in Paris led to a policy commitment of limiting the global temperature increase to 1.5–2.0 °C and this can be translated to a global annual greenhouse gas (GHG) emission budget that is shrinking rapidly throughout the 21st century. Here, we estimate the reductions in GHG emission intensities of technologies that will be required for the embedded GHG emissions of a developed nation to stay within its fair share of a global emission budget in the year 2050. The estimates are made for different conceivable developments in consumption patterns in the case of Denmark, based on a large survey of current consumption patterns. To evaluate whether the required emission intensity reductions are likely to be met, they are compared to historic time series of emission intensities and to projections for 2050, based on policies currently in place, for ten technologies that have a high contribution to current GHG emissions.
We estimate that emission intensities must be reduced by factors of 2–12 and 5–14, depending on the development in consumption, for the 2.0 and 1.5 °C climate goals, respectively. Of the ten selected technologies, only electricity supply is projected to, partially, meet the most strict reduction target, applying to a scenario where all inhabitants in 2050 consume as the most consuming inhabitants today.
The results indicate that both a change in “consumption as usual” and in “business as usual” is needed for developed nations to meet equitable climate targets. This has implications for national and international policies targeting GHG emission intensities and may require a new orientation of policies to consider the societal structures around consumption.
The UN 2030 Agenda for Sustainable Development provides 17 Sustainable Development Goals (SDGs) and 169 accompanying targets, with so far 230 indicators.
However, the 169 indicators were developed for Governments and NGO’s and not for business. For instance, none of the indicators underlying the Climate goal have business relevance, as they are focussing on policies, subsidies, etc. This means a first hurdle that needs to be taken is the re-interpretation of the indicators to link them to business and especially to decisions around product strategy and development [1].
This project provided two different tools, each with their use case:
There is a linkage between this project and the work done in our SDG club (now continued in the LCSA Club)
Available publications from the project:
Relative importance of sustainability impact pathways – A first rough assessment
Data collection guideline for pressure indicators for LCSA
Data files for Life Cycle SDG Assessment
[1] Business and Sustainable Development Commission (2017). Better Business Better World. London, January 2017. Link
The oversupply of nutrients (phosphorous and nitrogen) in fresh and marine water bodies presents a serious ecosystem threat due to impacts on water quality through eutrophication. With agriculture characterized as a primary driver of eutrophication, the role of food consumption and trade has been the focus of recent phosphorus and nitrogen impact studies. However, the environmental impacts associated with non-food commodities are significant and yet to be characterized. Here, we link a spatially explicit treatment of phosphorous and nitrogen eutrophication potentials to a multi-regional input–output approach to characterize the importance of overall consumption for marine and freshwater eutrophication across 44 countries and 5 rest-of-world regions over the period 2000–2011. We find that clothing, goods for shelter, services and other manufactured products account for 35% of global marine eutrophication and 38% of the global freshwater eutrophication footprints in 2011, up from 31 and 33%, respectively, in 2000. Relative to food consumption, non-food consumption is also significantly more income elastic and shaped by trade. As economies develop, this points to the need for trade agreements and policies to consider the displacement of ecosystem impacts.
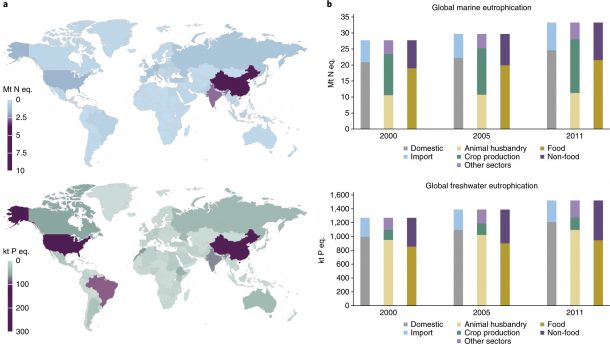
Global ME and FE footprints for 2011 by country (a) and for the years 2000, 2005 and 2011 (b).
Footprints are broken down based on whether they occurred domestically or from the consumption of imported products, by producing sector (crop production, animal husbandry and other sectors), and by consumed product type (food and non-food). Global footprint totals are equal to global total direct impacts. See Supplementary Information for numerical values.
complimentary link to full paper


